Here is your latest Area Report, analyzing data as it affects a specific market area. The Market Summary below offers a look at sales activity for the prior month and year, along with current and past year-to-date statistics. The graphs cover several different aspects of the real estate market. Note how some of the graphs break out trends by price increments. Please contact us if you would like more information on the current market.
Sold Properties | Number of properties sold during the year New Properties | Number of properties listed during the year.
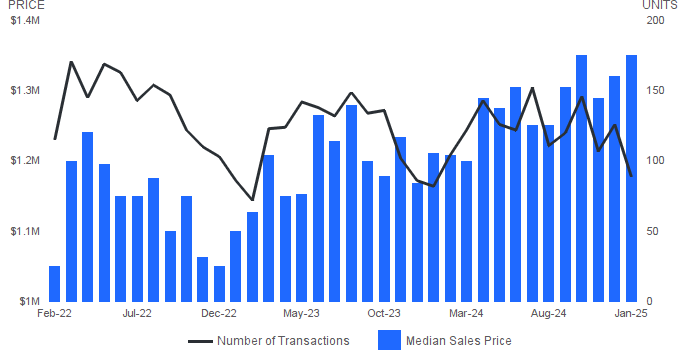
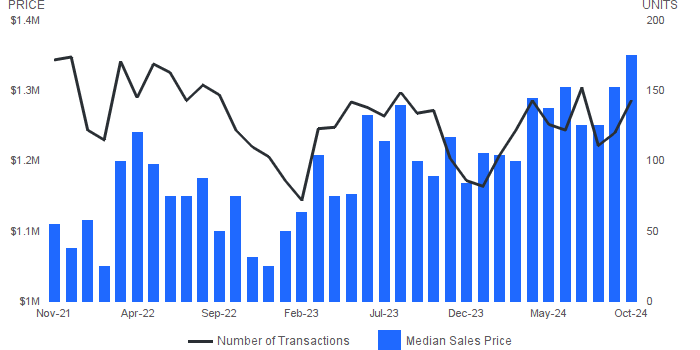
MEDIAN SALES PRICE AND NUMBER OF SALES
August 2025 | All Property Types
Median Sales Price | Price of the “”middle”” property sold -an equal number of sales were above and below this price. Number of Sales | Number of properties sold.
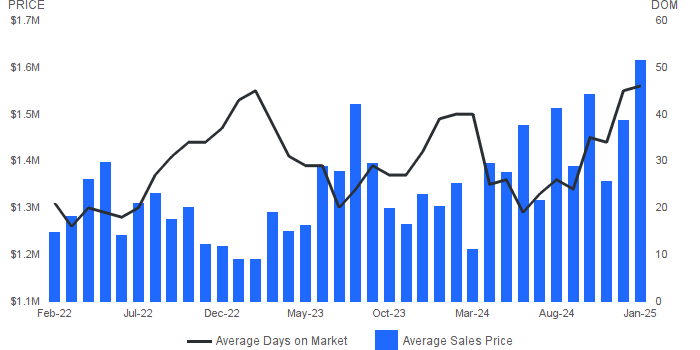
AVERAGE SALES PRICE AND AVERAGE DAYS ON MARKET
August 2025 | All Property Types
Average Sales Price | Average sales price for all properties sold. Average Days on Market | Average days on market for all properties sold.
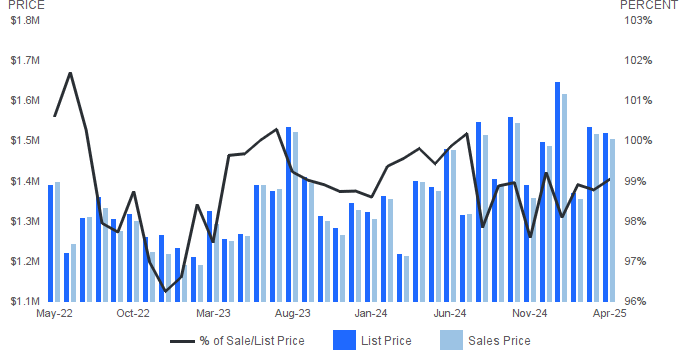
SALES PRICE AS A PERCENTAGE OF ORIGINAL PRICE
August 2025 | All Property Types
Sale Price as a Percentage of Original Price | Average sale price of property as percentage of final list price.
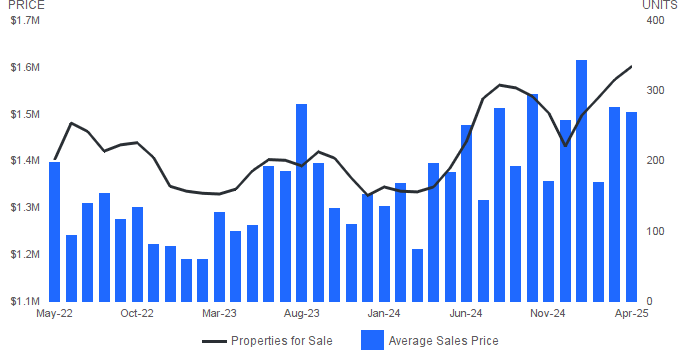
AVERAGE SALES PRICE AND NUMBER OF PROPERTIES FOR SALE
August 2025 | All Property Types
Average Sales Price | Average sales price for all properties sold. Properties for Sale | Number of properties listed for sale at the end of month.
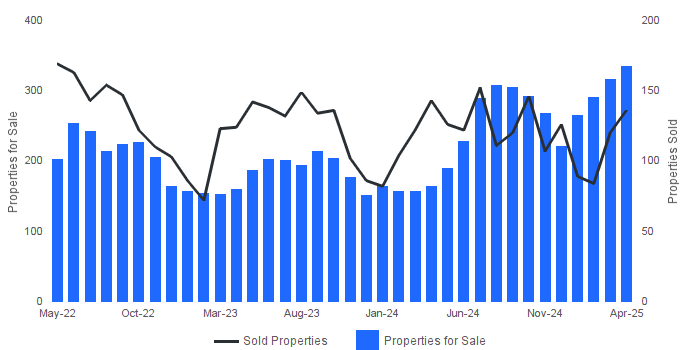
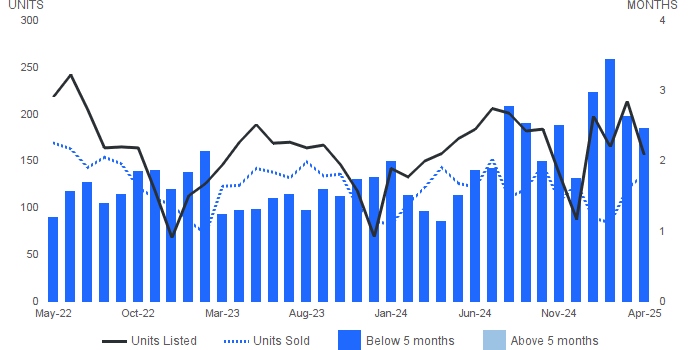
PROPERTIES FOR SALE AND SOLD PROPERTIES
August 2025 | All Property Types
Properties for Sale | Number of properties listed for sale at the end of month. Sold Properties | Number of properties sold.
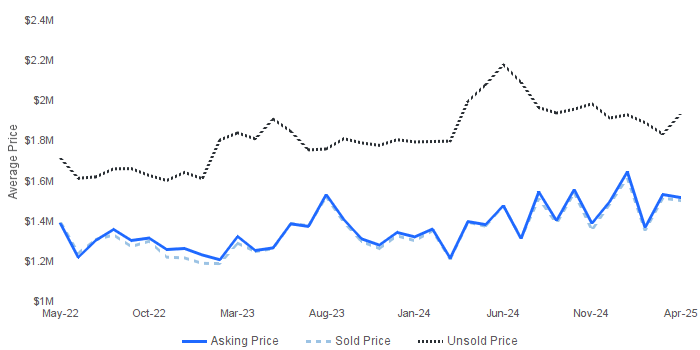
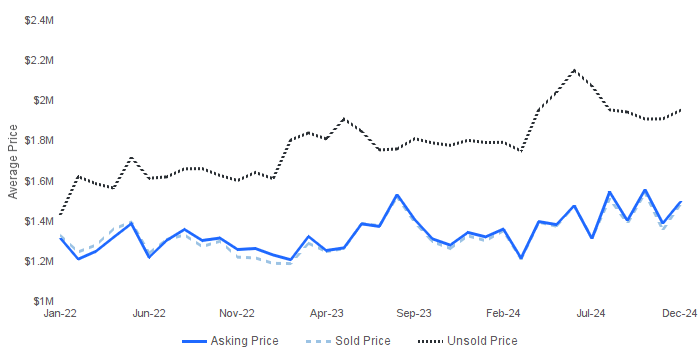
AVERAGE ASKING/SOLD/UNSOLD PRICE
August 2025 | All Property Types
Asking Price | the average asking price of sold properties Sold Price | the average selling price Unsold Price | the average active list price
ABSORPTION RATE
August 2025 | All Property Types
Absorption Rate | Looks at the past year’s monthly supply of inventory. In a normal market there should be a 6 month supply. The higher the rate above 6 the more aggressive a seller has to be with the competition; price and having a picture perfect property.
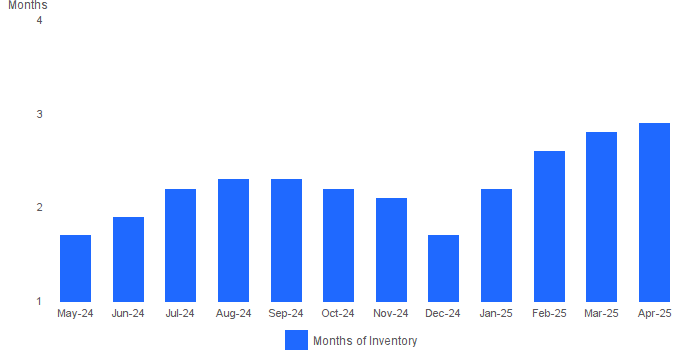
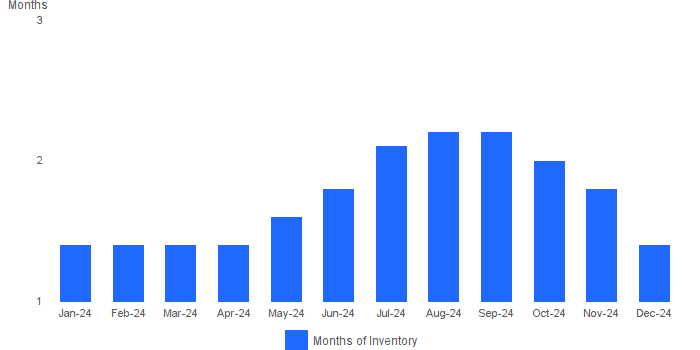
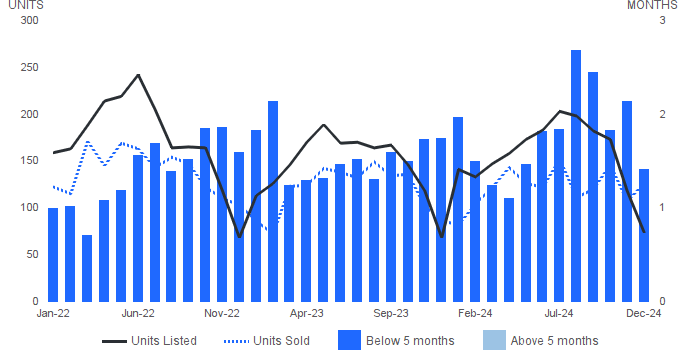
MONTHS SUPPLY OF INVENTORY
August 2025 | All Property Types
Months Supply of Inventory | Properties for sale divided by number of properties sold. Units Listed | Number of properties listed for sale at the end of month. Units Sold | Number of properties sold.
Here is your latest Area Report, analyzing data as it affects a specific market area. The Market Summary below offers a look at sales activity for the prior month and year, along with current and past year-to-date statistics. The graphs cover several different aspects of the real estate market. Note how some of the graphs break out trends by price increments.
Please contact me if you would like more information on the current market.
Follow this link if the report is not showing in your browser: https://mce.cbprospectsquare.com/prj/cwb/history/MT/2025-06/MT_99201_17214509_884672_193311.htm
Sold Properties | Number of properties sold during the year New Properties | Number of properties listed during the year.
MEDIAN SALES PRICE AND NUMBER OF SALES
June 2025 | All Property Types
Median Sales Price | Price of the “”middle”” property sold -an equal number of sales were above and below this price. Number of Sales | Number of properties sold.
AVERAGE SALES PRICE AND AVERAGE DAYS ON MARKET
June 2025 | All Property Types
Average Sales Price | Average sales price for all properties sold. Average Days on Market | Average days on market for all properties sold.
SALES PRICE AS A PERCENTAGE OF ORIGINAL PRICE
June 2025 | All Property Types
Sale Price as a Percentage of Original Price | Average sale price of property as percentage of final list price.
AVERAGE SALES PRICE AND NUMBER OF PROPERTIES FOR SALE
June 2025 | All Property Types
Average Sales Price | Average sales price for all properties sold. Properties for Sale | Number of properties listed for sale at the end of month.
PROPERTIES FOR SALE AND SOLD PROPERTIES
June 2025 | All Property Types
Properties for Sale | Number of properties listed for sale at the end of month. Sold Properties | Number of properties sold.
AVERAGE ASKING/SOLD/UNSOLD PRICE
June 2025 | All Property Types
Asking Price | the average asking price of sold properties Sold Price | the average selling price Unsold Price | the average active list price
ABSORPTION RATE
June 2025 | All Property Types
Absorption Rate | Looks at the past year’s monthly supply of inventory. In a normal market there should be a 6 month supply. The higher the rate above 6 the more aggressive a seller has to be with the competition; price and having a picture perfect property.
MONTHS SUPPLY OF INVENTORY
June 2025 | All Property Types
Months Supply of Inventory | Properties for sale divided by number of properties sold. Units Listed | Number of properties listed for sale at the end of month. Units Sold | Number of properties sold.
Here is your latest Area Report, analyzing data as it affects a specific market area. The Market Summary below offers a look at sales activity for the prior month and year, along with current and past year-to-date statistics. The graphs cover several different aspects of the real estate market. Note how some of the graphs break out trends by price increments. Please contact us if you would like more information on the current market.
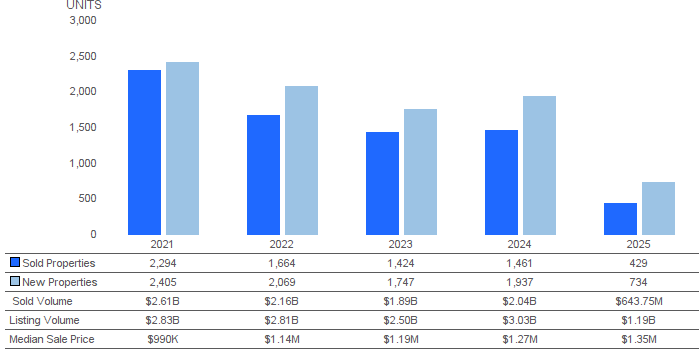
Sold Properties | Number of properties sold during the year New Properties | Number of properties listed during the year.
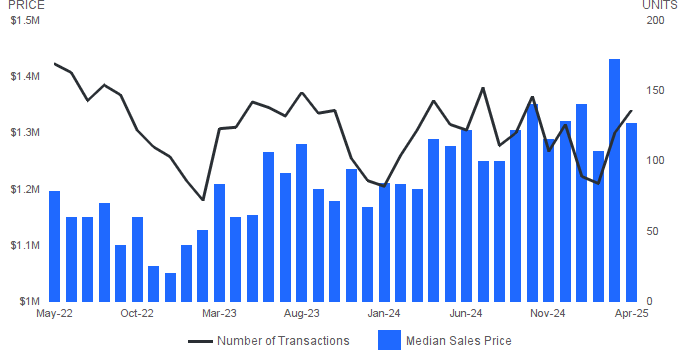
MEDIAN SALES PRICE AND NUMBER OF SALES
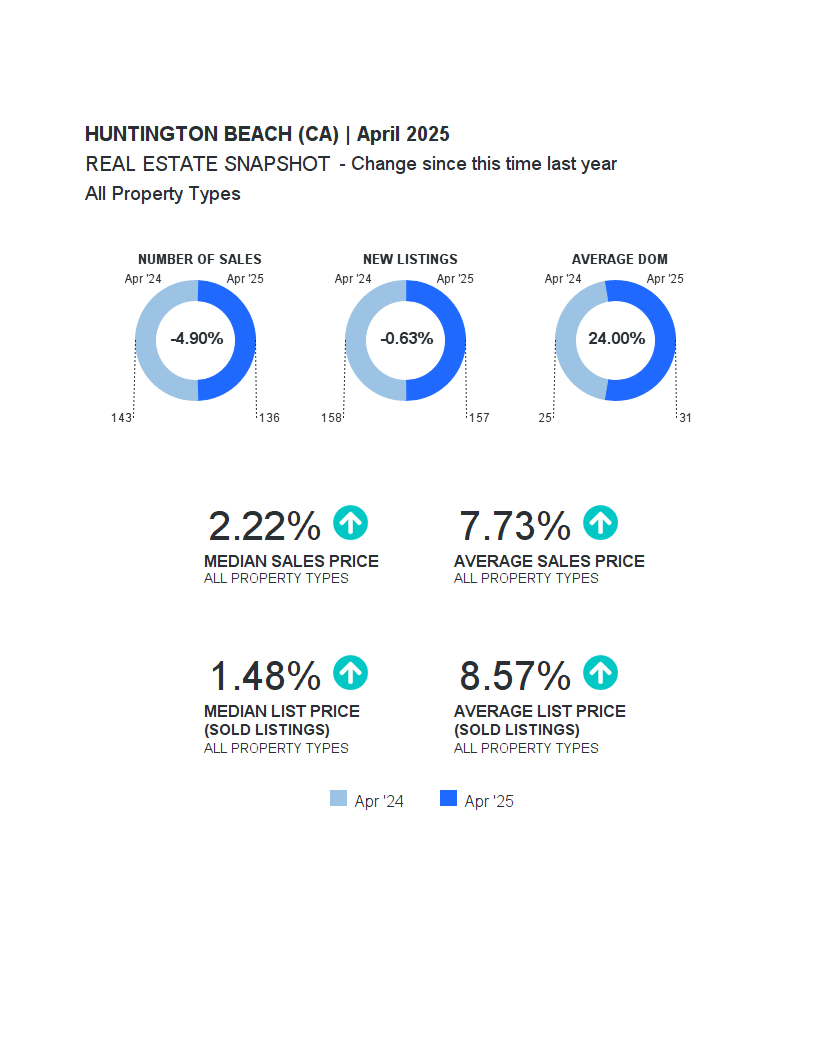
April 2025 | All Property Types
Median Sales Price | Price of the “”middle”” property sold -an equal number of sales were above and below this price. Number of Sales | Number of properties sold.
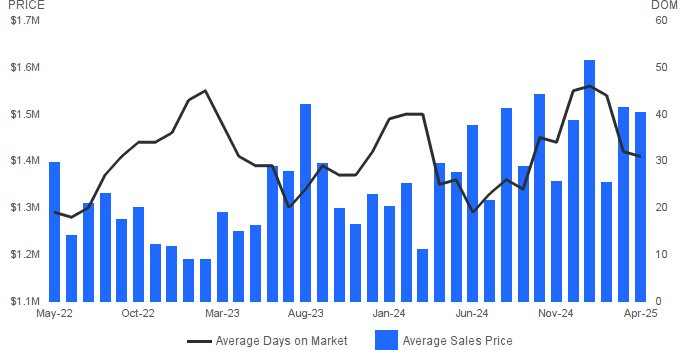
AVERAGE SALES PRICE AND AVERAGE DAYS ON MARKET
April 2025 | All Property Types
Average Sales Price | Average sales price for all properties sold. Average Days on Market | Average days on market for all properties sold.
SALES PRICE AS A PERCENTAGE OF ORIGINAL PRICE
April 2025 | All Property Types
Sale Price as a Percentage of Original Price | Average sale price of property as percentage of final list price.
AVERAGE SALES PRICE AND NUMBER OF PROPERTIES FOR SALE
April 2025 | All Property Types
Average Sales Price | Average sales price for all properties sold. Properties for Sale | Number of properties listed for sale at the end of month.
PROPERTIES FOR SALE AND SOLD PROPERTIES
April 2025 | All Property Types
Properties for Sale | Number of properties listed for sale at the end of month. Sold Properties | Number of properties sold.
AVERAGE ASKING/SOLD/UNSOLD PRICE
April 2025 | All Property Types
Asking Price | the average asking price of sold properties Sold Price | the average selling price Unsold Price | the average active list price
ABSORPTION RATE
April 2025 | All Property Types
Absorption Rate | Looks at the past year’s monthly supply of inventory. In a normal market there should be a 6 month supply. The higher the rate above 6 the more aggressive a seller has to be with the competition; price and having a picture perfect property.
MONTHS SUPPLY OF INVENTORY
April 2025 | All Property Types
Months Supply of Inventory | Properties for sale divided by number of properties sold. Units Listed | Number of properties listed for sale at the end of month. Units Sold | Number of properties sold.
Here is your latest Area Report, analyzing data as it affects a specific market area. The Market Summary below offers a look at sales activity for the prior month and year, along with current and past year-to-date statistics. The graphs cover several different aspects of the real estate market. Note how some of the graphs break out trends by price increments. Please contact us if you would like more information on the current market.
Sold Properties | Number of properties sold during the year New Properties | Number of properties listed during the year.
MEDIAN SALES PRICE AND NUMBER OF SALES
January 2025 | All Property Types
Median Sales Price | Price of the “”middle”” property sold -an equal number of sales were above and below this price. Number of Sales | Number of properties sold.
AVERAGE SALES PRICE AND AVERAGE DAYS ON MARKET
January 2025 | All Property Types
Average Sales Price | Average sales price for all properties sold. Average Days on Market | Average days on market for all properties sold.
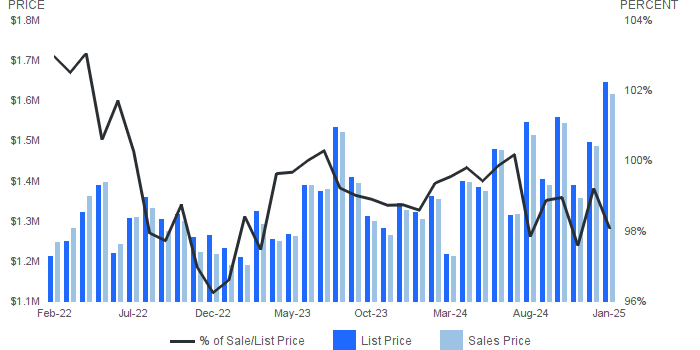
SALES PRICE AS A PERCENTAGE OF ORIGINAL PRICE
January 2025 | All Property Types
Sale Price as a Percentage of Original Price | Average sale price of property as percentage of final list price.
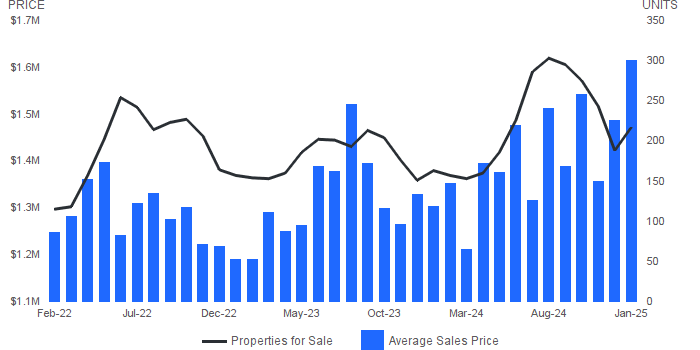
AVERAGE SALES PRICE AND NUMBER OF PROPERTIES FOR SALE
January 2025 | All Property Types
Average Sales Price | Average sales price for all properties sold. Properties for Sale | Number of properties listed for sale at the end of month.
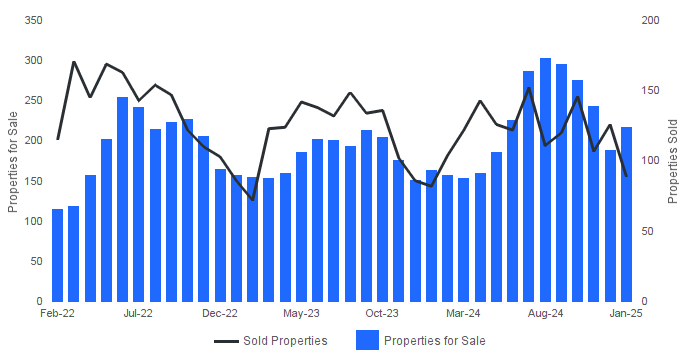
PROPERTIES FOR SALE AND SOLD PROPERTIES
January 2025 | All Property Types
Properties for Sale | Number of properties listed for sale at the end of month. Sold Properties | Number of properties sold.
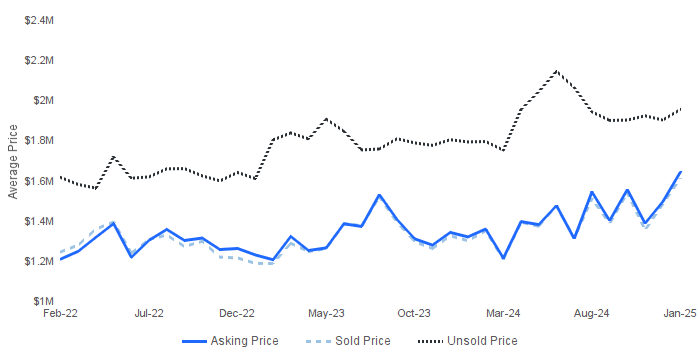
AVERAGE ASKING/SOLD/UNSOLD PRICE
January 2025 | All Property Types
Asking Price | the average asking price of sold properties Sold Price | the average selling price Unsold Price | the average active list price
ABSORPTION RATE
January 2025 | All Property Types
Absorption Rate | Looks at the past year’s monthly supply of inventory. In a normal market there should be a 6 month supply. The higher the rate above 6 the more aggressive a seller has to be with the competition; price and having a picture perfect property.
MONTHS SUPPLY OF INVENTORY
January 2025 | All Property Types
Months Supply of Inventory | Properties for sale divided by number of properties sold. Units Listed | Number of properties listed for sale at the end of month. Units Sold | Number of properties sold.
Sold Properties | Number of properties sold during the year New Properties | Number of properties listed during the year.
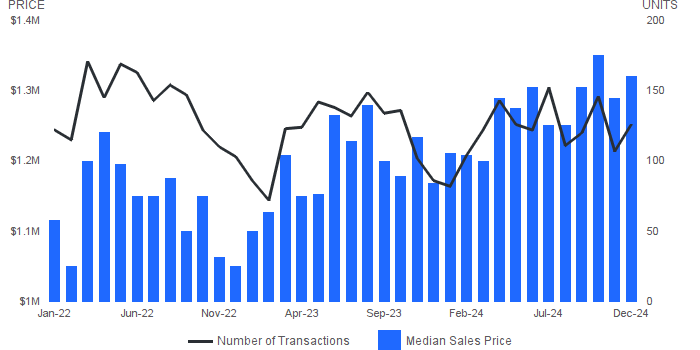
MEDIAN SALES PRICE AND NUMBER OF SALES
December 2024 | All Property Types
Median Sales Price | Price of the “”middle”” property sold -an equal number of sales were above and below this price. Number of Sales | Number of properties sold.
AVERAGE SALES PRICE AND AVERAGE DAYS ON MARKET
December 2024 | All Property Types
Average Sales Price | Average sales price for all properties sold. Average Days on Market | Average days on market for all properties sold.
SALES PRICE AS A PERCENTAGE OF ORIGINAL PRICE
December 2024 | All Property Types
Sale Price as a Percentage of Original Price | Average sale price of property as percentage of final list price.
AVERAGE SALES PRICE AND NUMBER OF PROPERTIES FOR SALE
December 2024 | All Property Types
Average Sales Price | Average sales price for all properties sold. Properties for Sale | Number of properties listed for sale at the end of month.
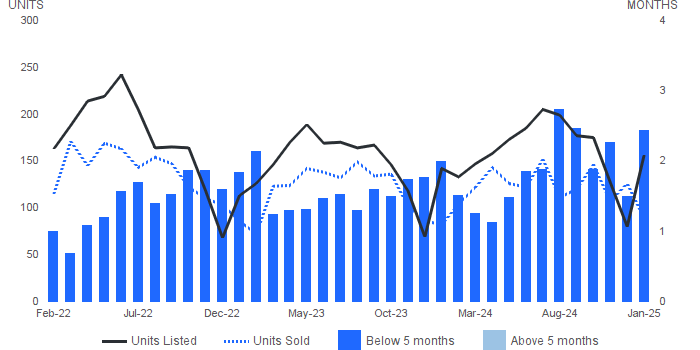
PROPERTIES FOR SALE AND SOLD PROPERTIES
December 2024 | All Property Types
Properties for Sale | Number of properties listed for sale at the end of month. Sold Properties | Number of properties sold.
AVERAGE ASKING/SOLD/UNSOLD PRICE
December 2024 | All Property Types
Asking Price | the average asking price of sold properties Sold Price | the average selling price Unsold Price | the average active list price
ABSORPTION RATE
December 2024 | All Property Types
Absorption Rate | Looks at the past year’s monthly supply of inventory. In a normal market there should be a 6 month supply. The higher the rate above 6 the more aggressive a seller has to be with the competition; price and having a picture perfect property.
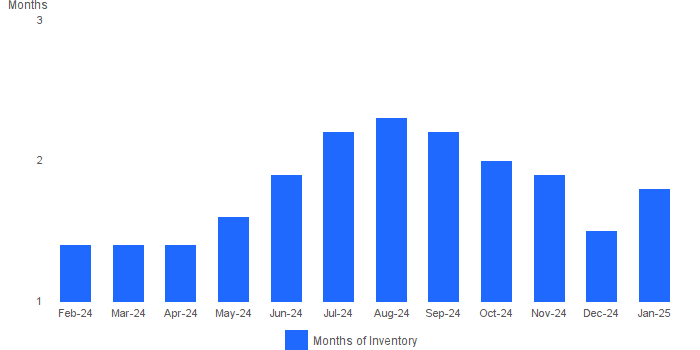
MONTHS SUPPLY OF INVENTORY
December 2024 | All Property Types
Months Supply of Inventory | Properties for sale divided by number of properties sold. Units Listed | Number of properties listed for sale at the end of month. Units Sold | Number of properties sold.
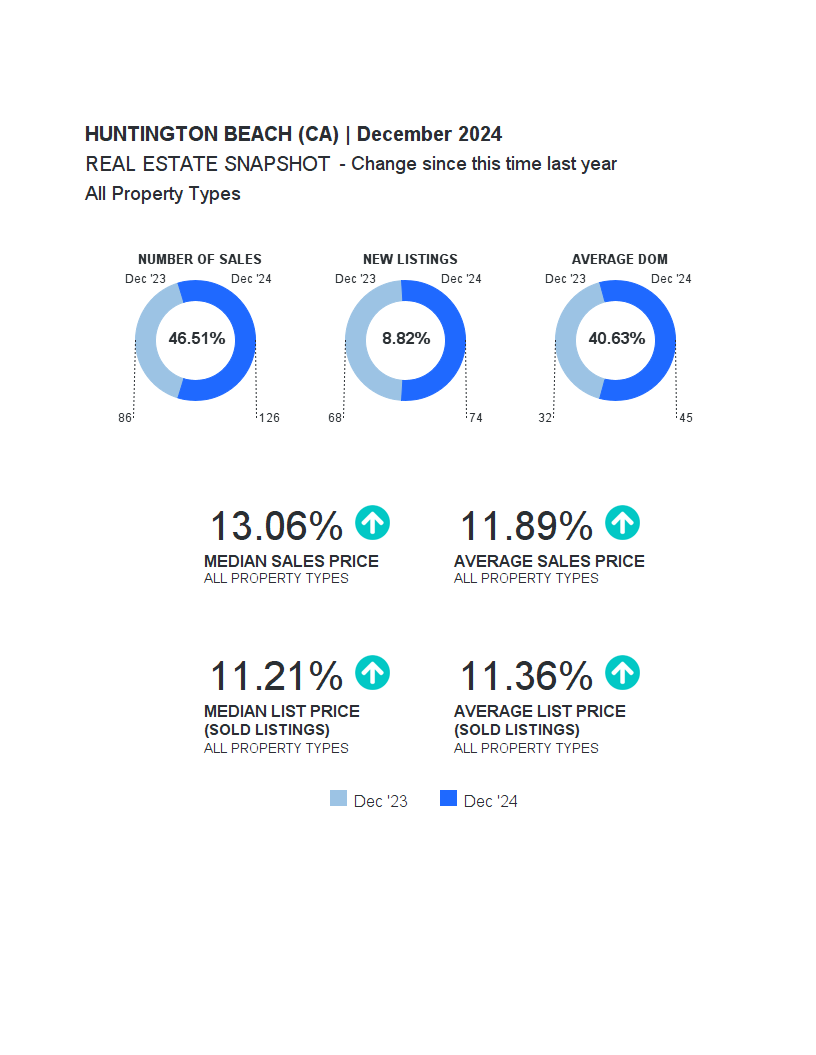
Area Report
HUNTINGTON BEACH (CA)
OCTOBER 2024 | ALL PROPERTY TYPES
Dear Homeowner,
Here is your latest Area Report, analyzing data as it affects a specific market area. The Market Summary below offers a look at sales activity for the prior month and year, along with current and past year-to-date statistics. The graphs cover several different aspects of the real estate market. Note how some of the graphs break out trends by price increments. Please contact us if you would like more information on the current market.
Sold Properties | Number of properties sold during the year New Properties | Number of properties listed during the year.
MEDIAN SALES PRICE AND NUMBER OF SALES
October 2024 | All Property Types
Median Sales Price | Price of the “”middle”” property sold -an equal number of sales were above and below this price. Number of Sales | Number of properties sold.
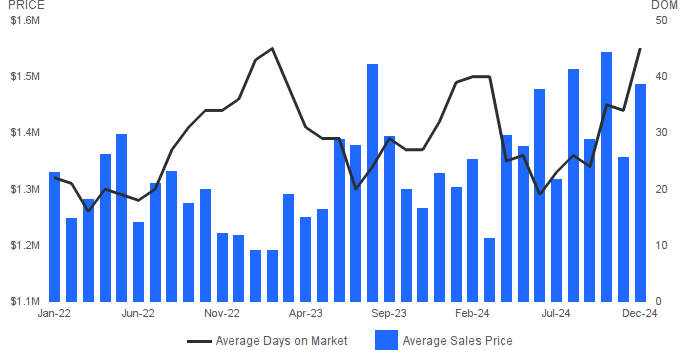
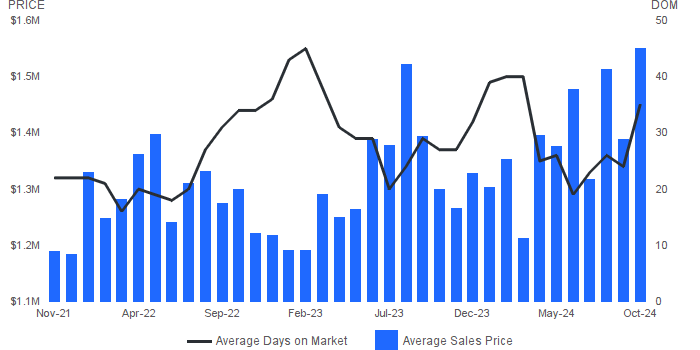
AVERAGE SALES PRICE AND AVERAGE DAYS ON MARKET
October 2024 | All Property Types
Average Sales Price | Average sales price for all properties sold. Average Days on Market | Average days on market for all properties sold.
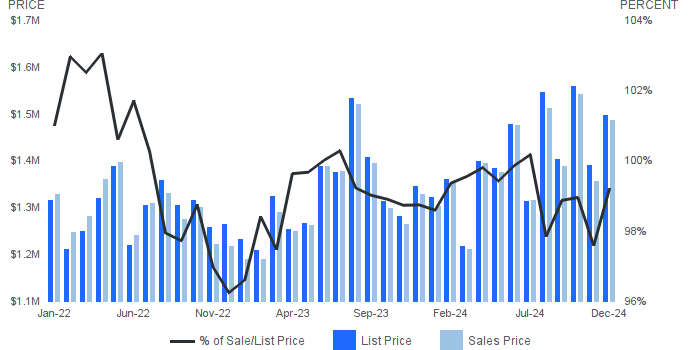
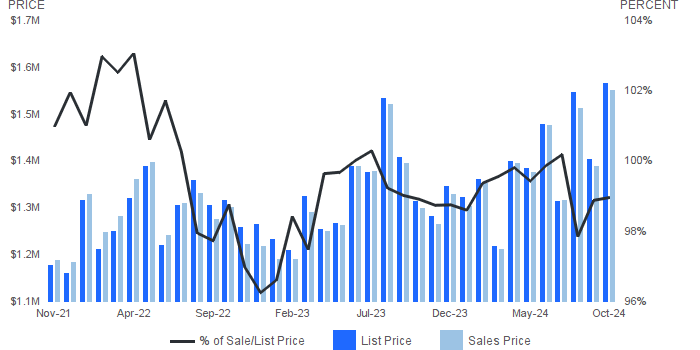
SALES PRICE AS A PERCENTAGE OF ORIGINAL PRICE
October 2024 | All Property Types
Sale Price as a Percentage of Original Price | Average sale price of property as percentage of final list price.
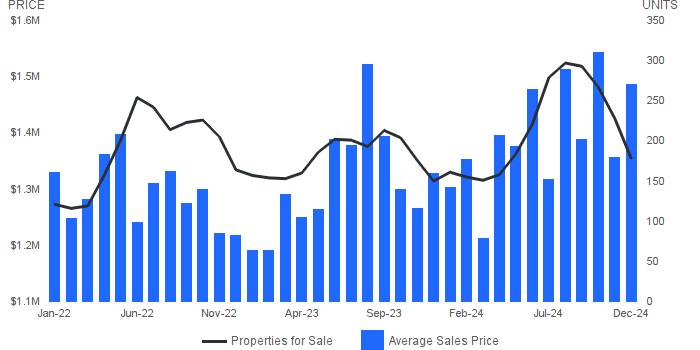
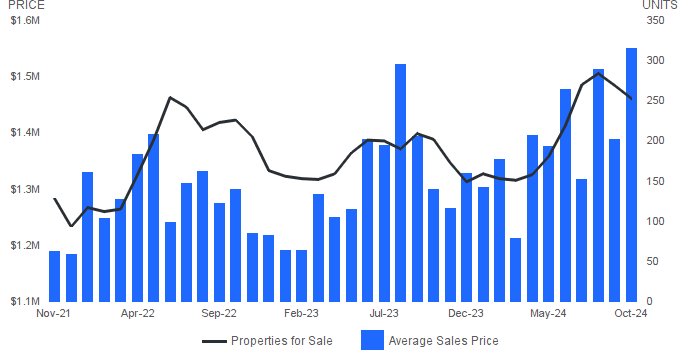
AVERAGE SALES PRICE AND NUMBER OF PROPERTIES FOR SALE
October 2024 | All Property Types
Average Sales Price | Average sales price for all properties sold. Properties for Sale | Number of properties listed for sale at the end of month.
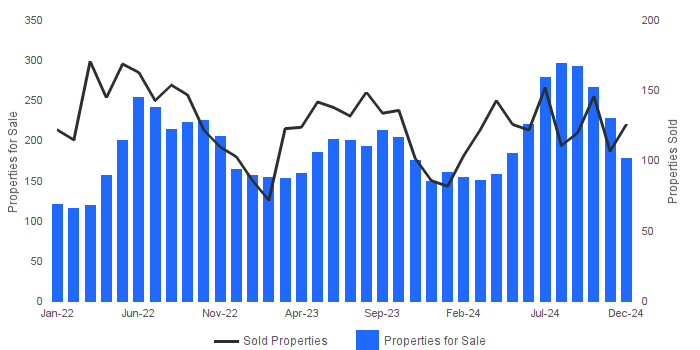
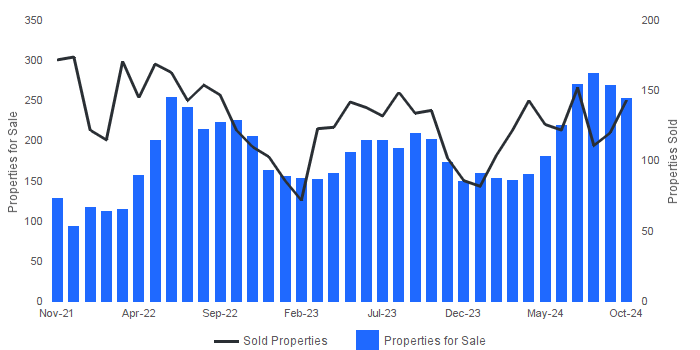
PROPERTIES FOR SALE AND SOLD PROPERTIES
October 2024 | All Property Types
Properties for Sale | Number of properties listed for sale at the end of month. Sold Properties | Number of properties sold.
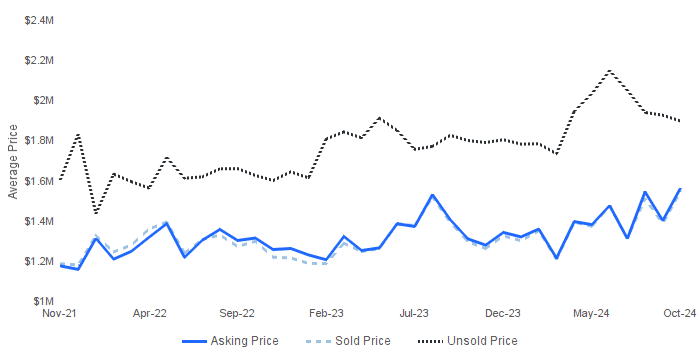
AVERAGE ASKING/SOLD/UNSOLD PRICE
October 2024 | All Property Types
Asking Price | the average asking price of sold properties Sold Price | the average selling price Unsold Price | the average active list price
ABSORPTION RATE
October 2024 | All Property Types
Absorption Rate | Looks at the past year’s monthly supply of inventory. In a normal market there should be a 6 month supply. The higher the rate above 6 the more aggressive a seller has to be with the competition; price and having a picture perfect property.
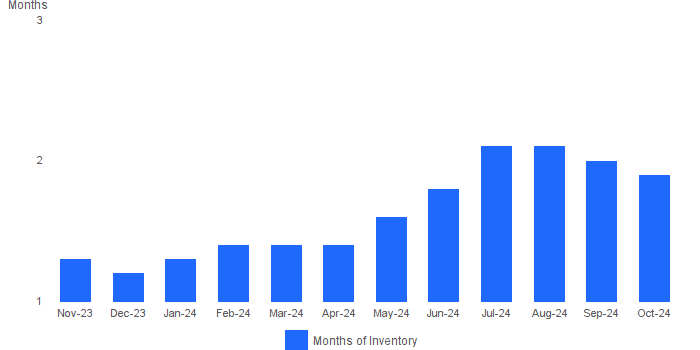
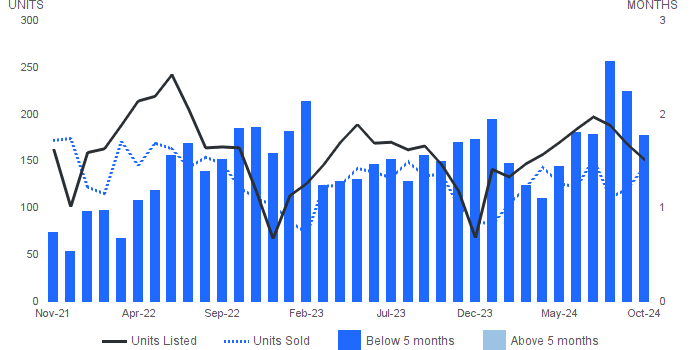
MONTHS SUPPLY OF INVENTORY
October 2024 | All Property Types
Months Supply of Inventory | Properties for sale divided by number of properties sold. Units Listed | Number of properties listed for sale at the end of month. Units Sold | Number of properties sold.
Here is your latest Area Report, analyzing data as it affects a specific market area. The Market Summary below offers a look at sales activity for the prior month and year, along with current and past year-to-date statistics. The graphs cover several different aspects of the real estate market. Note how some of the graphs break out trends by price increments. Please contact us if you would like more information on the current market.
Sold Properties | Number of properties sold during the year New Properties | Number of properties listed during the year.
MEDIAN SALES PRICE AND NUMBER OF SALES
September 2024 | All Property Types
Median Sales Price | Price of the “”middle”” property sold -an equal number of sales were above and below this price. Number of Sales | Number of properties sold.
AVERAGE SALES PRICE AND AVERAGE DAYS ON MARKET
September 2024 | All Property Types
Average Sales Price | Average sales price for all properties sold. Average Days on Market | Average days on market for all properties sold.
SALES PRICE AS A PERCENTAGE OF ORIGINAL PRICE
September 2024 | All Property Types
Sale Price as a Percentage of Original Price | Average sale price of property as percentage of final list price.
AVERAGE SALES PRICE AND NUMBER OF PROPERTIES FOR SALE
September 2024 | All Property Types
Average Sales Price | Average sales price for all properties sold. Properties for Sale | Number of properties listed for sale at the end of month.
PROPERTIES FOR SALE AND SOLD PROPERTIES
September 2024 | All Property Types
Properties for Sale | Number of properties listed for sale at the end of month. Sold Properties | Number of properties sold.
AVERAGE ASKING/SOLD/UNSOLD PRICE
September 2024 | All Property Types
Asking Price | the average asking price of sold properties Sold Price | the average selling price Unsold Price | the average active list price
ABSORPTION RATE
September 2024 | All Property Types
Absorption Rate | Looks at the past year’s monthly supply of inventory. In a normal market there should be a 6 month supply. The higher the rate above 6 the more aggressive a seller has to be with the competition; price and having a picture perfect property.
MONTHS SUPPLY OF INVENTORY
September 2024 | All Property Types
Months Supply of Inventory | Properties for sale divided by number of properties sold. Units Listed | Number of properties listed for sale at the end of month. Units Sold | Number of properties sold.
Here is your latest Area Report, analyzing data as it affects a specific market area. The Market Summary below offers a look at sales activity for the prior month and year, along with current and past year-to-date statistics. The graphs cover several different aspects of the real estate market. Note how some of the graphs break out trends by price increments. Please contact us if you would like more information on the current market.
Here is your latest Area Report, analyzing data as it affects a specific market area. The Market Summary below offers a look at sales activity for the prior month and year, along with current and past year-to-date statistics. The graphs cover several different aspects of the real estate market. Note how some of the graphs break out trends by price increments. Please contact us if you would like more information on the current market.
Sold Properties | Number of properties sold during the year New Properties | Number of properties listed during the year.
MEDIAN SALES PRICE AND NUMBER OF SALES
June 2024 | All Property Types
Median Sales Price | Price of the “”middle”” property sold -an equal number of sales were above and below this price. Number of Sales | Number of properties sold.
AVERAGE SALES PRICE AND AVERAGE DAYS ON MARKET
June 2024 | All Property Types
Average Sales Price | Average sales price for all properties sold. Average Days on Market | Average days on market for all properties sold.
SALES PRICE AS A PERCENTAGE OF ORIGINAL PRICE
June 2024 | All Property Types
Sale Price as a Percentage of Original Price | Average sale price of property as percentage of final list price.
AVERAGE SALES PRICE AND NUMBER OF PROPERTIES FOR SALE
June 2024 | All Property Types
Average Sales Price | Average sales price for all properties sold. Properties for Sale | Number of properties listed for sale at the end of month.
PROPERTIES FOR SALE AND SOLD PROPERTIES
June 2024 | All Property Types
Properties for Sale | Number of properties listed for sale at the end of month. Sold Properties | Number of properties sold.
AVERAGE ASKING/SOLD/UNSOLD PRICE
June 2024 | All Property Types
Asking Price | the average asking price of sold properties Sold Price | the average selling price Unsold Price | the average active list price
ABSORPTION RATE
June 2024 | All Property Types
Absorption Rate | Looks at the past year’s monthly supply of inventory. In a normal market there should be a 6 month supply. The higher the rate above 6 the more aggressive a seller has to be with the competition; price and having a picture perfect property.
MONTHS SUPPLY OF INVENTORY
June 2024 | All Property Types
Months Supply of Inventory | Properties for sale divided by number of properties sold. Units Listed | Number of properties listed for sale at the end of month. Units Sold | Number of properties sold.
Here is your latest Area Report, analyzing data as it affects a specific market area. The Market Summary below offers a look at sales activity for the prior month and year, along with current and past year-to-date statistics. The graphs cover several different aspects of the real estate market. Note how some of the graphs break out trends by price increments. Please contact us if you would like more information on the current market.
Sold Properties | Number of properties sold during the year New Properties | Number of properties listed during the year.
MEDIAN SALES PRICE AND NUMBER OF SALES
May 2024 | All Property Types
Median Sales Price | Price of the “”middle”” property sold -an equal number of sales were above and below this price. Number of Sales | Number of properties sold.
AVERAGE SALES PRICE AND AVERAGE DAYS ON MARKET
May 2024 | All Property Types
Average Sales Price | Average sales price for all properties sold. Average Days on Market | Average days on market for all properties sold.
SALES PRICE AS A PERCENTAGE OF ORIGINAL PRICE
May 2024 | All Property Types
Sale Price as a Percentage of Original Price | Average sale price of property as percentage of final list price.
AVERAGE SALES PRICE AND NUMBER OF PROPERTIES FOR SALE
May 2024 | All Property Types
Average Sales Price | Average sales price for all properties sold. Properties for Sale | Number of properties listed for sale at the end of month.
PROPERTIES FOR SALE AND SOLD PROPERTIES
May 2024 | All Property Types
Properties for Sale | Number of properties listed for sale at the end of month. Sold Properties | Number of properties sold.
AVERAGE ASKING/SOLD/UNSOLD PRICE
May 2024 | All Property Types
Asking Price | the average asking price of sold properties Sold Price | the average selling price Unsold Price | the average active list price
ABSORPTION RATE
May 2024 | All Property Types
Absorption Rate | Looks at the past year’s monthly supply of inventory. In a normal market there should be a 6 month supply. The higher the rate above 6 the more aggressive a seller has to be with the competition; price and having a picture perfect property.
MONTHS SUPPLY OF INVENTORY
May 2024 | All Property Types
Months Supply of Inventory | Properties for sale divided by number of properties sold. Units Listed | Number of properties listed for sale at the end of month. Units Sold | Number of properties sold.
Here is your latest Area Report, analyzing data as it affects a specific market area. The Market Summary below offers a look at sales activity for the prior month and year, along with current and past year-to-date statistics. The graphs cover several different aspects of the real estate market. Note how some of the graphs break out trends by price increments. Please contact us if you would like more information on the current market.
Sold Properties | Number of properties sold during the year New Properties | Number of properties listed during the year.
MEDIAN SALES PRICE AND NUMBER OF SALES
April 2024 | All Property Types
Median Sales Price | Price of the “”middle”” property sold -an equal number of sales were above and below this price. Number of Sales | Number of properties sold.
AVERAGE SALES PRICE AND AVERAGE DAYS ON MARKET
April 2024 | All Property Types
Average Sales Price | Average sales price for all properties sold. Average Days on Market | Average days on market for all properties sold.
SALES PRICE AS A PERCENTAGE OF ORIGINAL PRICE
April 2024 | All Property Types
Sale Price as a Percentage of Original Price | Average sale price of property as percentage of final list price.
AVERAGE SALES PRICE AND NUMBER OF PROPERTIES FOR SALE
April 2024 | All Property Types
Average Sales Price | Average sales price for all properties sold. Properties for Sale | Number of properties listed for sale at the end of month.
PROPERTIES FOR SALE AND SOLD PROPERTIES
April 2024 | All Property Types
Properties for Sale | Number of properties listed for sale at the end of month. Sold Properties | Number of properties sold.
AVERAGE ASKING/SOLD/UNSOLD PRICE
April 2024 | All Property Types
Asking Price | the average asking price of sold properties Sold Price | the average selling price Unsold Price | the average active list price
ABSORPTION RATE
April 2024 | All Property Types
Absorption Rate | Looks at the past year’s monthly supply of inventory. In a normal market there should be a 6 month supply. The higher the rate above 6 the more aggressive a seller has to be with the competition; price and having a picture perfect property.
MONTHS SUPPLY OF INVENTORY
April 2024 | All Property Types
Months Supply of Inventory | Properties for sale divided by number of properties sold. Units Listed | Number of properties listed for sale at the end of month. Units Sold | Number of properties sold.
Here is your latest Area Report, analyzing data as it affects a specific market area. The Market Summary below offers a look at sales activity for the prior month and year, along with current and past year-to-date statistics. The graphs cover several different aspects of the real estate market. Note how some of the graphs break out trends by price increments. Please contact us if you would like more information on the current market.
Sold Properties | Number of properties sold during the year New Properties | Number of properties listed during the year.
MEDIAN SALES PRICE AND NUMBER OF SALES
March 2024 | All Property Types
Median Sales Price | Price of the “”middle”” property sold -an equal number of sales were above and below this price. Number of Sales | Number of properties sold.
AVERAGE SALES PRICE AND AVERAGE DAYS ON MARKET
March 2024 | All Property Types
Average Sales Price | Average sales price for all properties sold. Average Days on Market | Average days on market for all properties sold.
SALES PRICE AS A PERCENTAGE OF ORIGINAL PRICE
March 2024 | All Property Types
Sale Price as a Percentage of Original Price | Average sale price of property as percentage of final list price.
AVERAGE SALES PRICE AND NUMBER OF PROPERTIES FOR SALE
March 2024 | All Property Types
Average Sales Price | Average sales price for all properties sold. Properties for Sale | Number of properties listed for sale at the end of month.
PROPERTIES FOR SALE AND SOLD PROPERTIES
March 2024 | All Property Types
Properties for Sale | Number of properties listed for sale at the end of month. Sold Properties | Number of properties sold.
AVERAGE ASKING/SOLD/UNSOLD PRICE
March 2024 | All Property Types
Asking Price | the average asking price of sold properties Sold Price | the average selling price Unsold Price | the average active list price
ABSORPTION RATE
March 2024 | All Property Types
Absorption Rate | Looks at the past year’s monthly supply of inventory. In a normal market there should be a 6 month supply. The higher the rate above 6 the more aggressive a seller has to be with the competition; price and having a picture perfect property.
MONTHS SUPPLY OF INVENTORY
March 2024 | All Property Types
Months Supply of Inventory | Properties for sale divided by number of properties sold. Units Listed | Number of properties listed for sale at the end of month. Units Sold | Number of properties sold.
Here is your latest Area Report, analyzing data as it affects a specific market area. The Market Summary below offers a look at sales activity for the prior month and year, along with current and past year-to-date statistics. The graphs cover several different aspects of the real estate market. Note how some of the graphs break out trends by price increments. Please contact us if you would like more information on the current market.
Sold Properties | Number of properties sold during the year New Properties | Number of properties listed during the year.
MEDIAN SALES PRICE AND NUMBER OF SALES
February 2024 | All Property Types
Median Sales Price | Price of the “”middle”” property sold -an equal number of sales were above and below this price. Number of Sales | Number of properties sold.
AVERAGE SALES PRICE AND AVERAGE DAYS ON MARKET
February 2024 | All Property Types
Average Sales Price | Average sales price for all properties sold. Average Days on Market | Average days on market for all properties sold.
SALES PRICE AS A PERCENTAGE OF ORIGINAL PRICE
February 2024 | All Property Types
Sale Price as a Percentage of Original Price | Average sale price of property as percentage of final list price.
AVERAGE SALES PRICE AND NUMBER OF PROPERTIES FOR SALE
February 2024 | All Property Types
Average Sales Price | Average sales price for all properties sold. Properties for Sale | Number of properties listed for sale at the end of month.
PROPERTIES FOR SALE AND SOLD PROPERTIES
February 2024 | All Property Types
Properties for Sale | Number of properties listed for sale at the end of month. Sold Properties | Number of properties sold.
AVERAGE ASKING/SOLD/UNSOLD PRICE
February 2024 | All Property Types
Asking Price | the average asking price of sold properties Sold Price | the average selling price Unsold Price | the average active list price
ABSORPTION RATE
February 2024 | All Property Types
Absorption Rate | Looks at the past year’s monthly supply of inventory. In a normal market there should be a 6 month supply. The higher the rate above 6 the more aggressive a seller has to be with the competition; price and having a picture perfect property.
MONTHS SUPPLY OF INVENTORY
February 2024 | All Property Types
Months Supply of Inventory | Properties for sale divided by number of properties sold. Units Listed | Number of properties listed for sale at the end of month. Units Sold | Number of properties sold.
Here is your latest Area Report, analyzing data as it affects a specific market area. The Market Summary below offers a look at sales activity for the prior month and year, along with current and past year-to-date statistics. The graphs cover several different aspects of the real estate market. Note how some of the graphs break out trends by price increments. Please contact us if you would like more information on the current market.
Sold Properties | Number of properties sold during the year New Properties | Number of properties listed during the year.
MEDIAN SALES PRICE AND NUMBER OF SALES
January 2024 | All Property Types
Median Sales Price | Price of the “”middle”” property sold -an equal number of sales were above and below this price. Number of Sales | Number of properties sold.
AVERAGE SALES PRICE AND AVERAGE DAYS ON MARKET
January 2024 | All Property Types
Average Sales Price | Average sales price for all properties sold. Average Days on Market | Average days on market for all properties sold.
SALES PRICE AS A PERCENTAGE OF ORIGINAL PRICE
January 2024 | All Property Types
Sale Price as a Percentage of Original Price | Average sale price of property as percentage of final list price.
AVERAGE SALES PRICE AND NUMBER OF PROPERTIES FOR SALE
January 2024 | All Property Types
Average Sales Price | Average sales price for all properties sold. Properties for Sale | Number of properties listed for sale at the end of month.
PROPERTIES FOR SALE AND SOLD PROPERTIES
January 2024 | All Property Types
Properties for Sale | Number of properties listed for sale at the end of month. Sold Properties | Number of properties sold.
AVERAGE ASKING/SOLD/UNSOLD PRICE
January 2024 | All Property Types
Asking Price | the average asking price of sold properties Sold Price | the average selling price Unsold Price | the average active list price
ABSORPTION RATE
January 2024 | All Property Types
Absorption Rate | Looks at the past year’s monthly supply of inventory. In a normal market there should be a 6 month supply. The higher the rate above 6 the more aggressive a seller has to be with the competition; price and having a picture perfect property.
MONTHS SUPPLY OF INVENTORY
January 2024 | All Property Types
Months Supply of Inventory | Properties for sale divided by number of properties sold. Units Listed | Number of properties listed for sale at the end of month. Units Sold | Number of properties sold.
Here is your latest Area Report, analyzing data as it affects a specific market area. The Market Summary below offers a look at sales activity for the prior month and year, along with current and past year-to-date statistics. The graphs cover several different aspects of the real estate market. Note how some of the graphs break out trends by price increments. Please contact us if you would like more information on the current market.
Sold Properties | Number of properties sold during the year New Properties | Number of properties listed during the year.
MEDIAN SALES PRICE AND NUMBER OF SALES
December 2023 | All Property Types
Median Sales Price | Price of the “”middle”” property sold -an equal number of sales were above and below this price. Number of Sales | Number of properties sold.
AVERAGE SALES PRICE AND AVERAGE DAYS ON MARKET
December 2023 | All Property Types
Average Sales Price | Average sales price for all properties sold. Average Days on Market | Average days on market for all properties sold.
SALES PRICE AS A PERCENTAGE OF ORIGINAL PRICE
December 2023 | All Property Types
Sale Price as a Percentage of Original Price | Average sale price of property as percentage of final list price.
AVERAGE SALES PRICE AND NUMBER OF PROPERTIES FOR SALE
December 2023 | All Property Types
Average Sales Price | Average sales price for all properties sold. Properties for Sale | Number of properties listed for sale at the end of month.
PROPERTIES FOR SALE AND SOLD PROPERTIES
December 2023 | All Property Types
Properties for Sale | Number of properties listed for sale at the end of month. Sold Properties | Number of properties sold.
AVERAGE ASKING/SOLD/UNSOLD PRICE
December 2023 | All Property Types
Asking Price | the average asking price of sold properties Sold Price | the average selling price Unsold Price | the average active list price
ABSORPTION RATE
December 2023 | All Property Types
Absorption Rate | Looks at the past year’s monthly supply of inventory. In a normal market there should be a 6 month supply. The higher the rate above 6 the more aggressive a seller has to be with the competition; price and having a picture perfect property.
MONTHS SUPPLY OF INVENTORY
December 2023 | All Property Types
Months Supply of Inventory | Properties for sale divided by number of properties sold. Units Listed | Number of properties listed for sale at the end of month. Units Sold | Number of properties sold.
Here is your latest Area Report, analyzing data as it affects a specific market area. The Market Summary below offers a look at sales activity for the prior month and year, along with current and past year-to-date statistics. The graphs cover several different aspects of the real estate market. Note how some of the graphs break out trends by price increments. Please contact us if you would like more information on the current market.
Sold Properties | Number of properties sold during the year New Properties | Number of properties listed during the year.
MEDIAN SALES PRICE AND NUMBER OF SALES
November 2023 | All Property Types
Median Sales Price | Price of the “”middle”” property sold -an equal number of sales were above and below this price. Number of Sales | Number of properties sold.
AVERAGE SALES PRICE AND AVERAGE DAYS ON MARKET
November 2023 | All Property Types
Average Sales Price | Average sales price for all properties sold. Average Days on Market | Average days on market for all properties sold.
SALES PRICE AS A PERCENTAGE OF ORIGINAL PRICE
November 2023 | All Property Types
Sale Price as a Percentage of Original Price | Average sale price of property as percentage of final list price.
AVERAGE SALES PRICE AND NUMBER OF PROPERTIES FOR SALE
November 2023 | All Property Types
Average Sales Price | Average sales price for all properties sold. Properties for Sale | Number of properties listed for sale at the end of month.
PROPERTIES FOR SALE AND SOLD PROPERTIES
November 2023 | All Property Types
Properties for Sale | Number of properties listed for sale at the end of month. Sold Properties | Number of properties sold.
AVERAGE ASKING/SOLD/UNSOLD PRICE
November 2023 | All Property Types
Asking Price | the average asking price of sold properties Sold Price | the average selling price Unsold Price | the average active list price
ABSORPTION RATE
November 2023 | All Property Types
Absorption Rate | Looks at the past year’s monthly supply of inventory. In a normal market there should be a 6 month supply. The higher the rate above 6 the more aggressive a seller has to be with the competition; price and having a picture perfect property.
MONTHS SUPPLY OF INVENTORY
November 2023 | All Property Types
Months Supply of Inventory | Properties for sale divided by number of properties sold. Units Listed | Number of properties listed for sale at the end of month. Units Sold | Number of properties sold.
Here is your latest Area Report, analyzing data as it affects a specific market area. The Market Summary below offers a look at sales activity for the prior month and year, along with current and past year-to-date statistics. The graphs cover several different aspects of the real estate market. Note how some of the graphs break out trends by price increments. Please contact us if you would like more information on the current market.
Sold Properties | Number of properties sold during the year New Properties | Number of properties listed during the year.
MEDIAN SALES PRICE AND NUMBER OF SALES
September 2023 | All Property Types
Median Sales Price | Price of the “”middle”” property sold -an equal number of sales were above and below this price. Number of Sales | Number of properties sold.
AVERAGE SALES PRICE AND AVERAGE DAYS ON MARKET
September 2023 | All Property Types
Average Sales Price | Average sales price for all properties sold. Average Days on Market | Average days on market for all properties sold.
SALES PRICE AS A PERCENTAGE OF ORIGINAL PRICE
September 2023 | All Property Types
Sale Price as a Percentage of Original Price | Average sale price of property as percentage of final list price.
AVERAGE SALES PRICE AND NUMBER OF PROPERTIES FOR SALE
September 2023 | All Property Types
Average Sales Price | Average sales price for all properties sold. Properties for Sale | Number of properties listed for sale at the end of month.
PROPERTIES FOR SALE AND SOLD PROPERTIES
September 2023 | All Property Types
Properties for Sale | Number of properties listed for sale at the end of month. Sold Properties | Number of properties sold.
AVERAGE ASKING/SOLD/UNSOLD PRICE
September 2023 | All Property Types
Asking Price | the average asking price of sold properties Sold Price | the average selling price Unsold Price | the average active list price
ABSORPTION RATE
September 2023 | All Property Types
Absorption Rate | Looks at the past year’s monthly supply of inventory. In a normal market there should be a 6 month supply. The higher the rate above 6 the more aggressive a seller has to be with the competition; price and having a picture perfect property.
MONTHS SUPPLY OF INVENTORY
September 2023 | All Property Types
Months Supply of Inventory | Properties for sale divided by number of properties sold. Units Listed | Number of properties listed for sale at the end of month. Units Sold | Number of properties sold.