The Quarterly Report offers insight into residential real estate sales activity and regional trends. It complements the Area Report, giving you a broader look at the real estate market.
If you are interested in receiving the Area Report, please let me know. I would be happy to set that up for you.
The market summary below offers a look at sales activity for the prior quarter and year, along with current and past year-to-date statistics. The graphs cover several different aspects of the real estate market. Note how some of the graphs break out trends by price increments.
Please contact me if you would like more information on your current market.
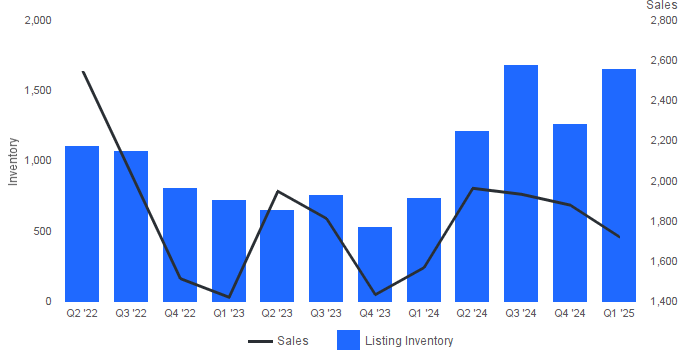
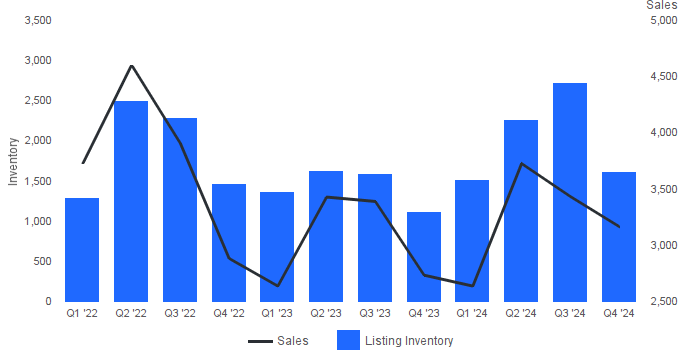
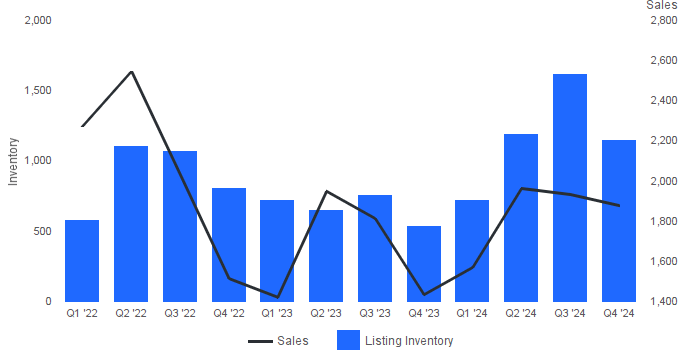
Quarterly inventory of properties for sale along with number of sales
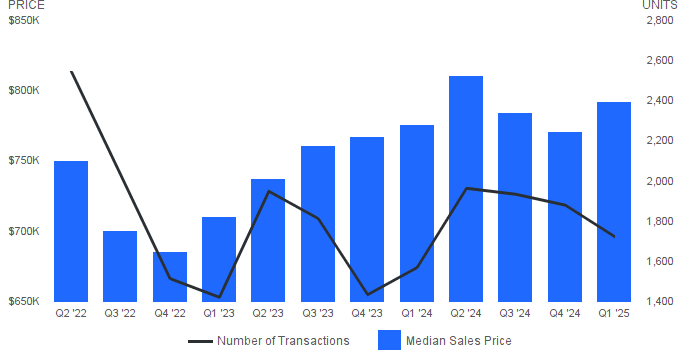
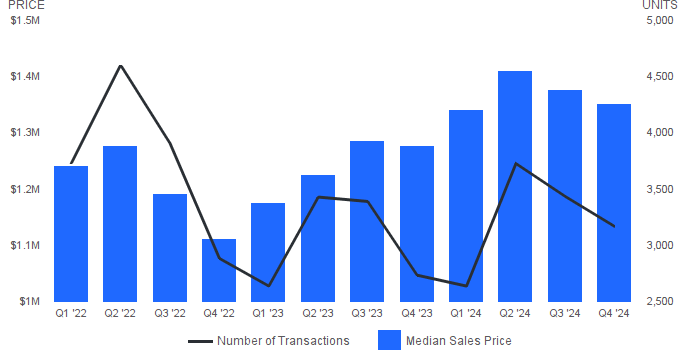
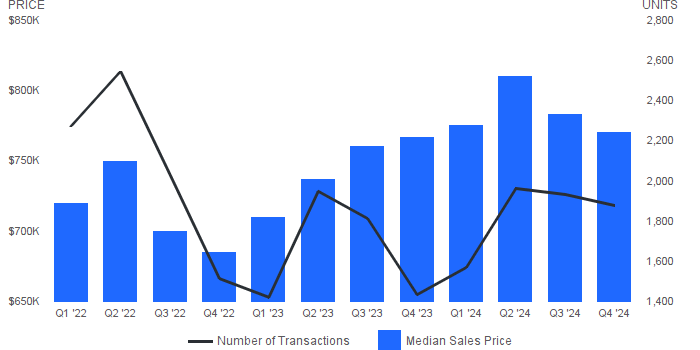
MEDIAN SALES PRICE AND NUMBER OF SALES
Q2 2025 | Single Family
Median Sales Price | Price of the “”middle”” property sold -an equal number of sales were above and below this price. Number of Sales | Number of properties sold.
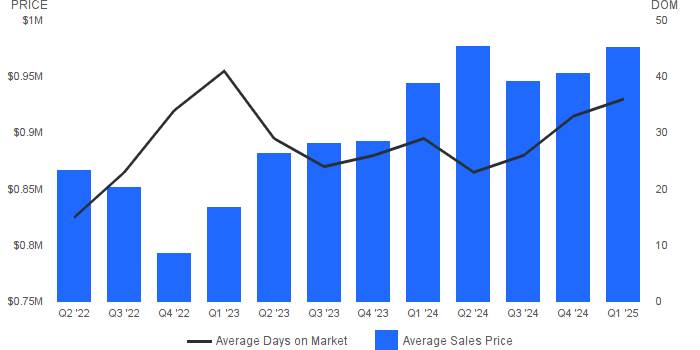
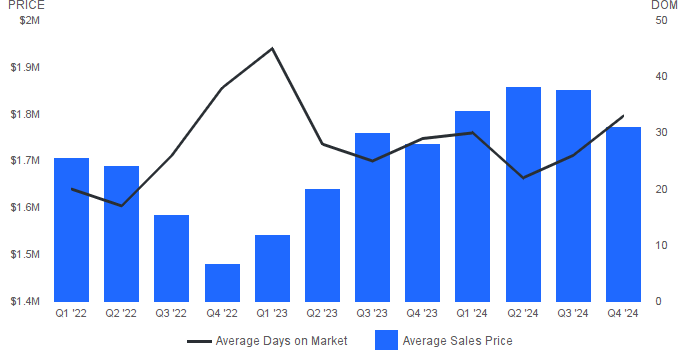
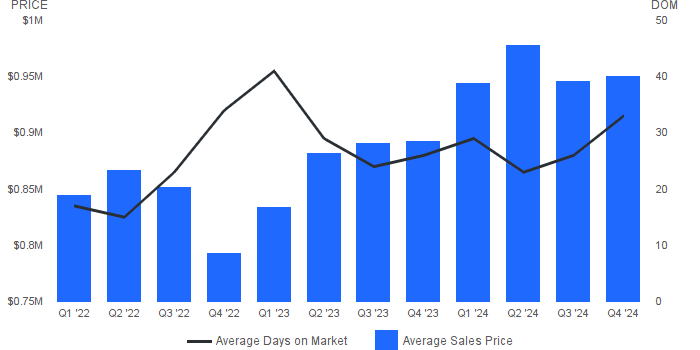
AVERAGE SALES PRICE AND AVERAGE DAYS ON MARKET
Q2 2025 | Single Family
Average Sales Price | Average sales price for all properties sold. Average Days on Market | Average days on market for all properties sold.
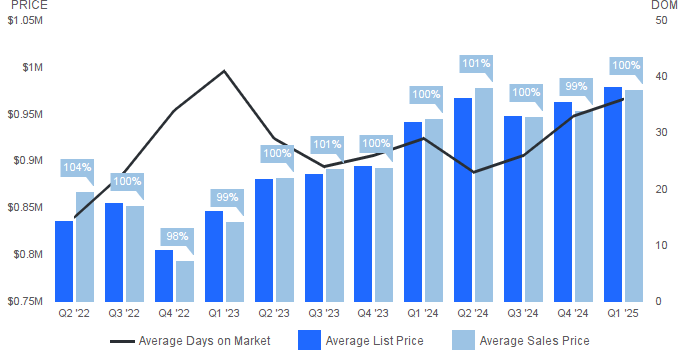
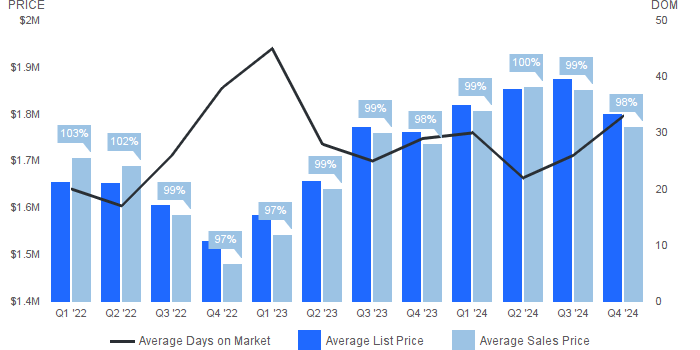
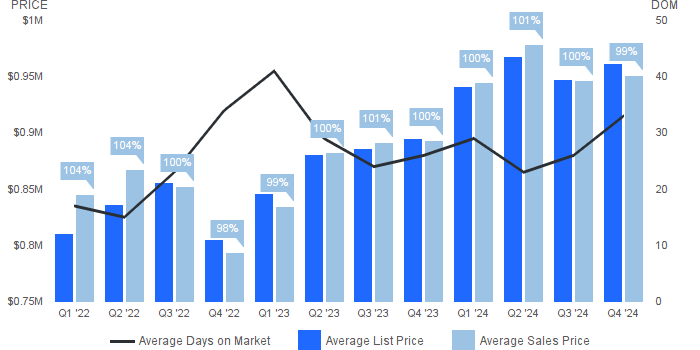
SALES PRICE AS A PERCENTAGE OF ORIGINAL PRICE & AVERAGE DOM
Q2 2025 | Single Family
Sale Price as a Percentage of Original Price | Average sale price of property as percentage of final list price. Average Days on Market | Average days on market for all properties sold.
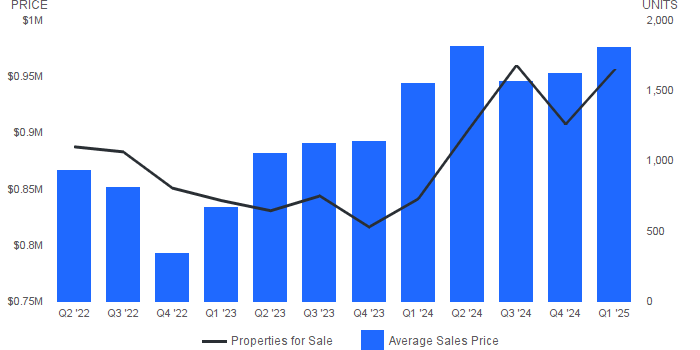
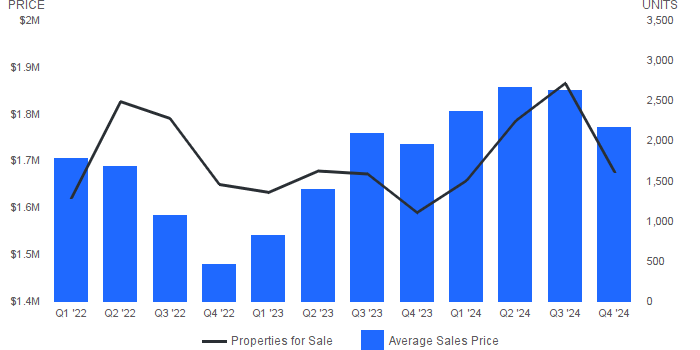
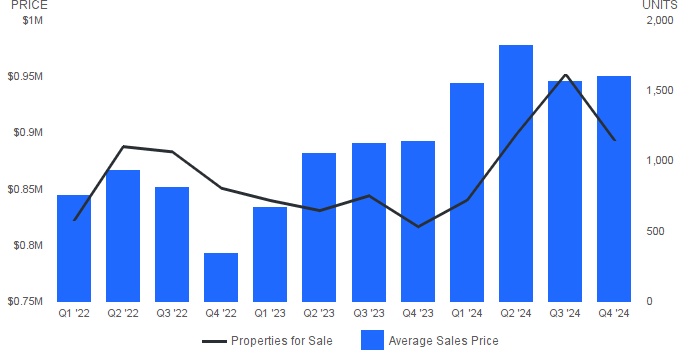
AVERAGE SALES PRICE AND NUMBER OF PROPERTIES FOR SALE
Q2 2025 | Single Family
Average Sales Price | Average sales price for all properties sold. Properties for Sale | Number of properties listed for sale at the end of quarter.
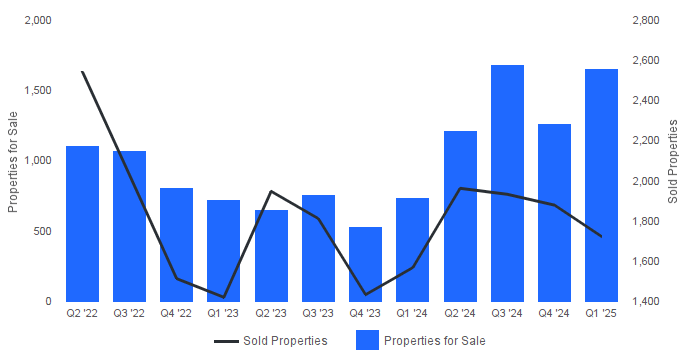
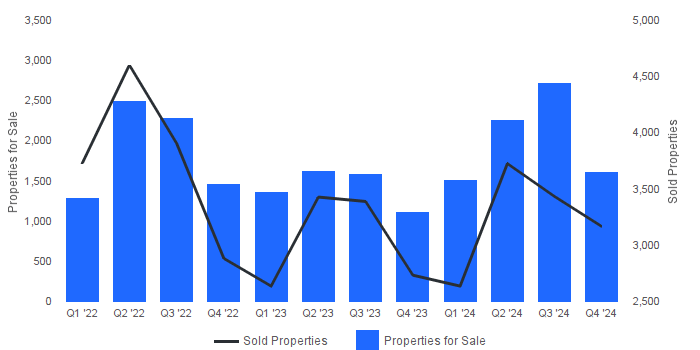
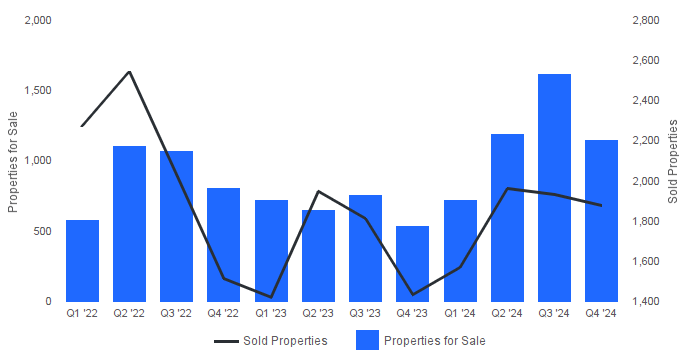
PROPERTIES FOR SALE AND SOLD PROPERTIES
Q2 2025 | Single Family
Properties for Sale | Number of properties listed for sale at the end of quarter. Sold Properties | Number of properties sold.
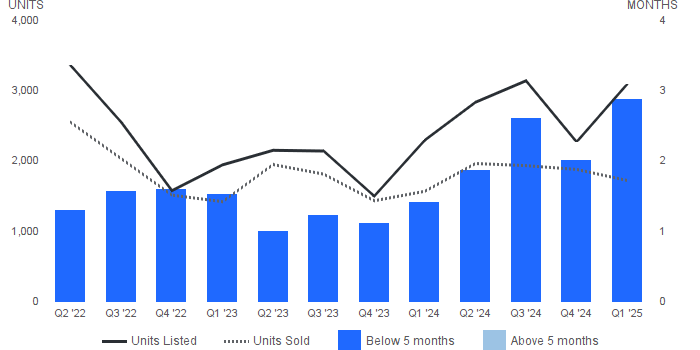
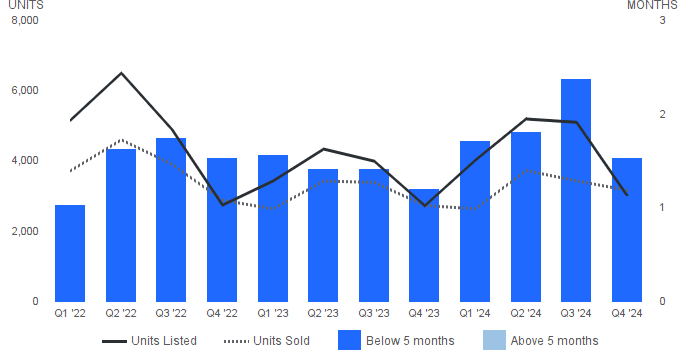
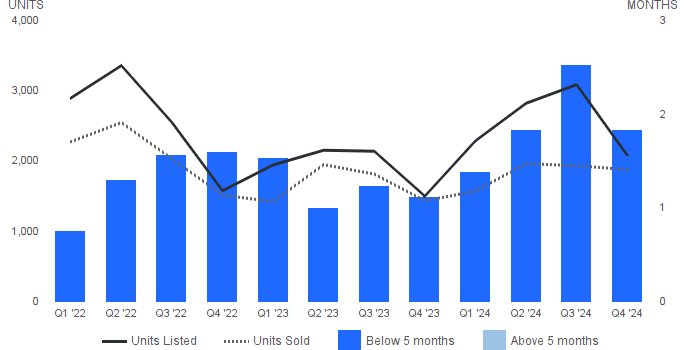
MONTHS SUPPLY OF INVENTORY
Q2 2025 | Single Family
Months Supply of Inventory | Properties for sale divided by number of properties sold. Units Listed | Number of properties listed for sale at the end of month. Units Sold | Number of properties sold.
REAL ESTATE
SNAPSHOT
ORANGE COUNTY
MARKET OVERVIEW
Q2 2025 | Condo
1.83%
PROPERTIES SOLD
Condo
-0.17%
AVERAGE SOLD PRICE
Condo
-1.23%
MEDIAN SOLD PRICE
Condo
20.93%
NEW LISTINGS
Condo
1.35%
AVERAGE LIST PRICE
Condo
0.50%
MEDIAN LIST PRICE
Condo
-1.38%
List/Sell Price Ratio
Condo
34.78%
AVERAGE DAYS ON MARKET
Condo
70.00%
MEDIAN DAYS ON MARKET
Condo
LISTING INVENTORY AND NUMBER OF SALES
Q2 2025 | Condo
Quarterly inventory of properties for sale along with number of sales
MEDIAN SALES PRICE AND NUMBER OF SALES
Q2 2025 | Condo
Median Sales Price | Price of the “”middle”” property sold -an equal number of sales were above and below this price. Number of Sales | Number of properties sold.
AVERAGE SALES PRICE AND AVERAGE DAYS ON MARKET
Q2 2025 | Condo
Average Sales Price | Average sales price for all properties sold. Average Days on Market | Average days on market for all properties sold.
SALES PRICE AS A PERCENTAGE OF ORIGINAL PRICE & AVERAGE DOM
Q2 2025 | Condo
Sale Price as a Percentage of Original Price | Average sale price of property as percentage of final list price. Average Days on Market | Average days on market for all properties sold.
AVERAGE SALES PRICE AND NUMBER OF PROPERTIES FOR SALE
Q2 2025 | Condo
Average Sales Price | Average sales price for all properties sold. Properties for Sale | Number of properties listed for sale at the end of quarter.
PROPERTIES FOR SALE AND SOLD PROPERTIES
Q2 2025 | Condo
Properties for Sale | Number of properties listed for sale at the end of quarter. Sold Properties | Number of properties sold.
MONTHS SUPPLY OF INVENTORY
Q2 2025 | Condo
Months Supply of Inventory | Properties for sale divided by number of properties sold. Units Listed | Number of properties listed for sale at the end of month. Units Sold | Number of properties sold.
MONTHLY REPORT AVAILABLE FOR SPECIFIED CITY/AREA/NEIGHBORHOOD.
QUARTERLY REPORT AVAILABLE FOR SPECIFIED CITY/AREA/NEIGHBORHOOD.
Cities, areas, neighborhoods or property types within a county that are not represented indicate there is not enough sold data to produce a monthly or quarterly report for that specific city. If you are interested in information for a specific city, area, neighborhood and/or property type, please contact a Coldwell Banker Independent Sales Associate.
Real Estate
Report
Q1 2025
ORANGE COUNTY
Dear Homeowner,
The Quarterly Report offers insight into residential real estate sales activity and regional trends. It complements the Area Report, giving you a broader look at the real estate market. If you are interested in receiving the Area Report, please let me know. I would be happy to set that up for you.
The market summary below offers a look at sales activity for the prior quarter and year, along with current and past year-to-date statistics. The graphs cover several different aspects of the real estate market. Note how some of the graphs break out trends by price increments. Please contact me if you would like more information on your current market.
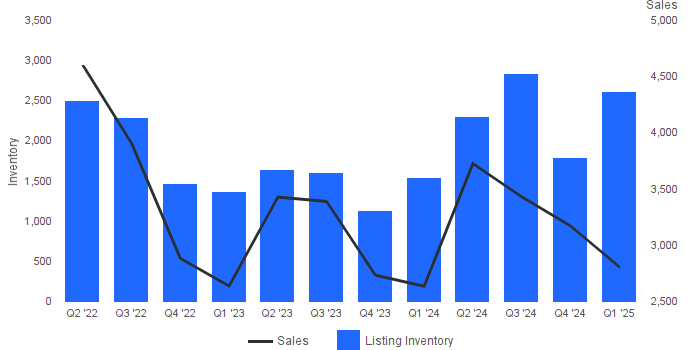
Quarterly inventory of properties for sale along with number of sales
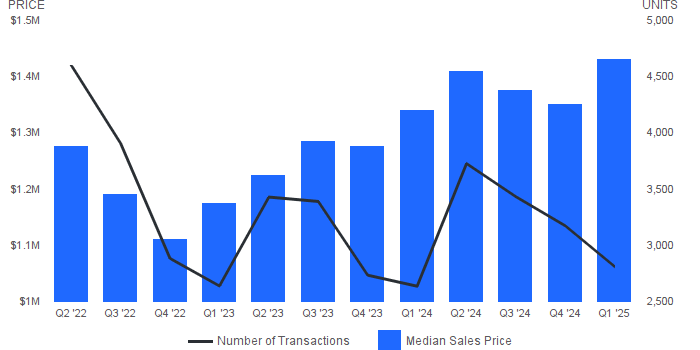
MEDIAN SALES PRICE AND NUMBER OF SALES
Q1 2025 | Single Family
Median Sales Price | Price of the “”middle”” property sold -an equal number of sales were above and below this price. Number of Sales | Number of properties sold.
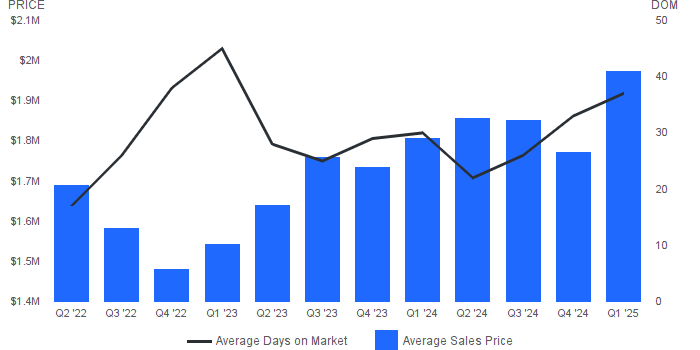
AVERAGE SALES PRICE AND AVERAGE DAYS ON MARKET
Q1 2025 | Single Family
Average Sales Price | Average sales price for all properties sold. Average Days on Market | Average days on market for all properties sold.
SALES PRICE AS A PERCENTAGE OF ORIGINAL PRICE & AVERAGE DOM
Q1 2025 | Single Family
Sale Price as a Percentage of Original Price | Average sale price of property as percentage of final list price. Average Days on Market | Average days on market for all properties sold.
AVERAGE SALES PRICE AND NUMBER OF PROPERTIES FOR SALE
Q1 2025 | Single Family
Average Sales Price | Average sales price for all properties sold. Properties for Sale | Number of properties listed for sale at the end of quarter.
PROPERTIES FOR SALE AND SOLD PROPERTIES
Q1 2025 | Single Family
Properties for Sale | Number of properties listed for sale at the end of quarter. Sold Properties | Number of properties sold.
MONTHS SUPPLY OF INVENTORY
Q1 2025 | Single Family
Months Supply of Inventory | Properties for sale divided by number of properties sold. Units Listed | Number of properties listed for sale at the end of month. Units Sold | Number of properties sold.
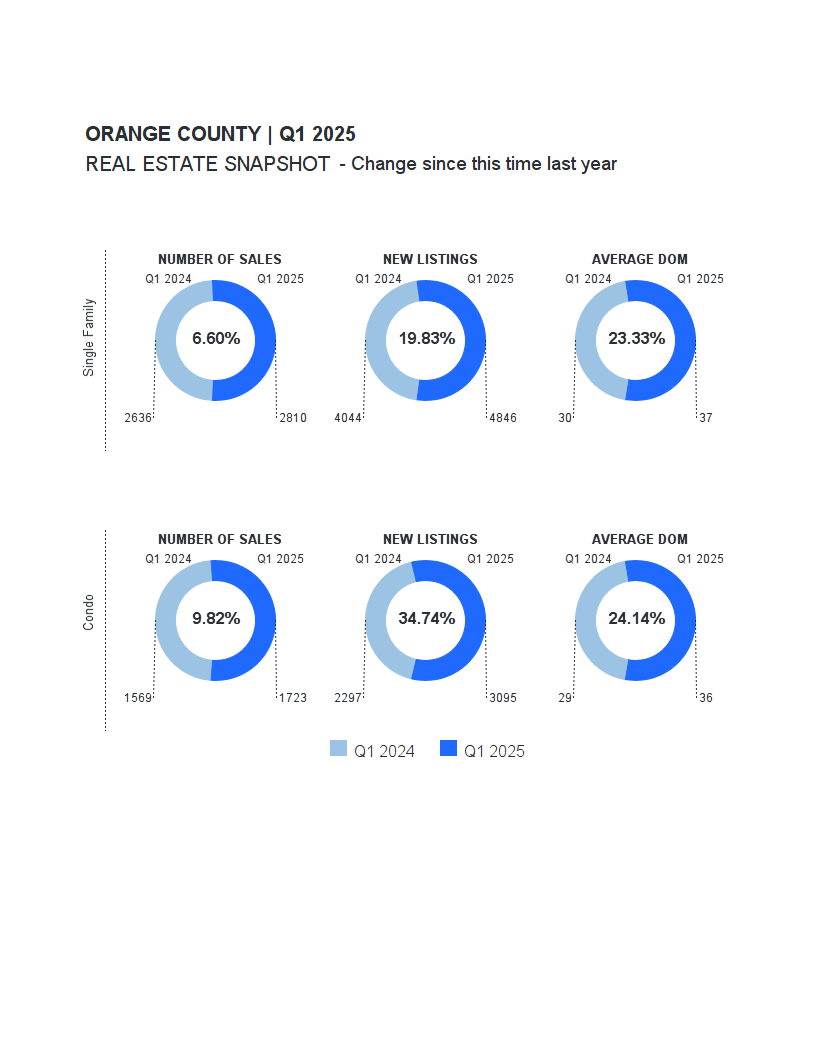
REAL ESTATE
SNAPSHOT
ORANGE COUNTY
MARKET OVERVIEW
Q1 2025 | Condo
9.82%
PROPERTIES SOLD
Condo
3.34%
AVERAGE SOLD PRICE
Condo
2.19%
MEDIAN SOLD PRICE
Condo
34.74%
NEW LISTINGS
Condo
3.96%
AVERAGE LIST PRICE
Condo
4.31%
MEDIAN LIST PRICE
Condo
-0.64%
List/Sell Price Ratio
Condo
24.14%
AVERAGE DAYS ON MARKET
Condo
53.85%
MEDIAN DAYS ON MARKET
Condo
LISTING INVENTORY AND NUMBER OF SALES
Q1 2025 | Condo
Quarterly inventory of properties for sale along with number of sales
MEDIAN SALES PRICE AND NUMBER OF SALES
Q1 2025 | Condo
Median Sales Price | Price of the “”middle”” property sold -an equal number of sales were above and below this price. Number of Sales | Number of properties sold.
AVERAGE SALES PRICE AND AVERAGE DAYS ON MARKET
Q1 2025 | Condo
Average Sales Price | Average sales price for all properties sold. Average Days on Market | Average days on market for all properties sold.
SALES PRICE AS A PERCENTAGE OF ORIGINAL PRICE & AVERAGE DOM
Q1 2025 | Condo
Sale Price as a Percentage of Original Price | Average sale price of property as percentage of final list price. Average Days on Market | Average days on market for all properties sold.
AVERAGE SALES PRICE AND NUMBER OF PROPERTIES FOR SALE
Q1 2025 | Condo
Average Sales Price | Average sales price for all properties sold. Properties for Sale | Number of properties listed for sale at the end of quarter.
PROPERTIES FOR SALE AND SOLD PROPERTIES
Q1 2025 | Condo
Properties for Sale | Number of properties listed for sale at the end of quarter. Sold Properties | Number of properties sold.
MONTHS SUPPLY OF INVENTORY
Q1 2025 | Condo
Months Supply of Inventory | Properties for sale divided by number of properties sold. Units Listed | Number of properties listed for sale at the end of month. Units Sold | Number of properties sold.
MONTHLY REPORT AVAILABLE FOR SPECIFIED CITY/AREA/NEIGHBORHOOD.
QUARTERLY REPORT AVAILABLE FOR SPECIFIED CITY/AREA/NEIGHBORHOOD.
Cities, areas, neighborhoods or property types within a county that are not represented indicate there is not enough sold data to produce a monthly or quarterly report for that specific city. If you are interested in information for a specific city, area, neighborhood and/or property type, please contact a Coldwell Banker Independent Sales Associate.
The Quarterly Report offers insight into residential real estate sales activity and regional trends. It complements the Area Report, giving you a broader look at the real estate market. If you are interested in receiving the Area Report, please let me know. I would be happy to set that up for you.
The market summary below offers a look at sales activity for the prior quarter and year, along with current and past year-to-date statistics. The graphs cover several different aspects of the real estate market. Note how some of the graphs break out trends by price increments. Please contact me if you would like more information on your current market.
Quarterly inventory of properties for sale along with number of sales
MEDIAN SALES PRICE AND NUMBER OF SALES
Q4 2024 | Single Family
Median Sales Price | Price of the “”middle”” property sold -an equal number of sales were above and below this price. Number of Sales | Number of properties sold.
AVERAGE SALES PRICE AND AVERAGE DAYS ON MARKET
Q4 2024 | Single Family
Average Sales Price | Average sales price for all properties sold. Average Days on Market | Average days on market for all properties sold.
SALES PRICE AS A PERCENTAGE OF ORIGINAL PRICE & AVERAGE DOM
Q4 2024 | Single Family
Sale Price as a Percentage of Original Price | Average sale price of property as percentage of final list price. Average Days on Market | Average days on market for all properties sold.
AVERAGE SALES PRICE AND NUMBER OF PROPERTIES FOR SALE
Q4 2024 | Single Family
Average Sales Price | Average sales price for all properties sold. Properties for Sale | Number of properties listed for sale at the end of quarter.
PROPERTIES FOR SALE AND SOLD PROPERTIES
Q4 2024 | Single Family
Properties for Sale | Number of properties listed for sale at the end of quarter. Sold Properties | Number of properties sold.
MONTHS SUPPLY OF INVENTORY
Q4 2024 | Single Family
Months Supply of Inventory | Properties for sale divided by number of properties sold. Units Listed | Number of properties listed for sale at the end of month. Units Sold | Number of properties sold.
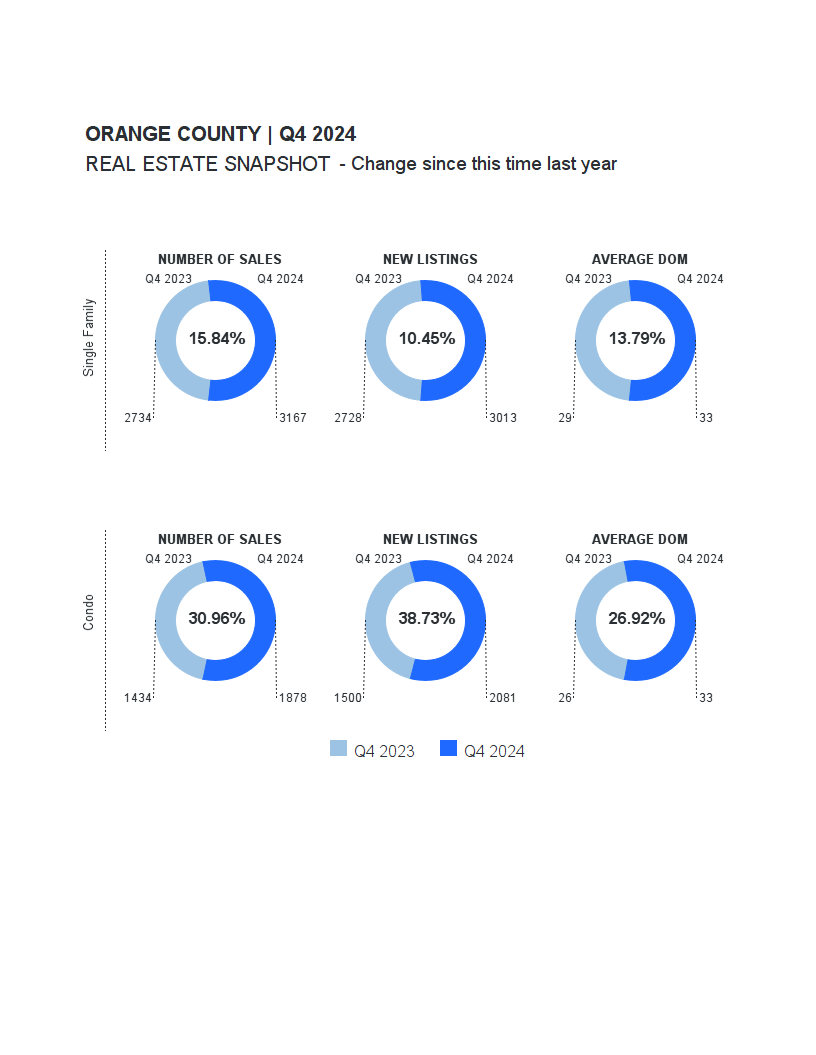
REAL ESTATE
SNAPSHOT
ORANGE COUNTY
MARKET OVERVIEW
Q4 2024 | Condo
30.96%
PROPERTIES SOLD
Condo
6.56%
AVERAGE SOLD PRICE
Condo
0.46%
MEDIAN SOLD PRICE
Condo
38.73%
NEW LISTINGS
Condo
7.50%
AVERAGE LIST PRICE
Condo
1.25%
MEDIAN LIST PRICE
Condo
-0.65%
List/Sell Price Ratio
Condo
26.92%
AVERAGE DAYS ON MARKET
Condo
42.86%
MEDIAN DAYS ON MARKET
Condo
LISTING INVENTORY AND NUMBER OF SALES
Q4 2024 | Condo
Quarterly inventory of properties for sale along with number of sales
MEDIAN SALES PRICE AND NUMBER OF SALES
Q4 2024 | Condo
Median Sales Price | Price of the “”middle”” property sold -an equal number of sales were above and below this price. Number of Sales | Number of properties sold.
AVERAGE SALES PRICE AND AVERAGE DAYS ON MARKET
Q4 2024 | Condo
Average Sales Price | Average sales price for all properties sold. Average Days on Market | Average days on market for all properties sold.
SALES PRICE AS A PERCENTAGE OF ORIGINAL PRICE & AVERAGE DOM
Q4 2024 | Condo
Sale Price as a Percentage of Original Price | Average sale price of property as percentage of final list price. Average Days on Market | Average days on market for all properties sold.
AVERAGE SALES PRICE AND NUMBER OF PROPERTIES FOR SALE
Q4 2024 | Condo
Average Sales Price | Average sales price for all properties sold. Properties for Sale | Number of properties listed for sale at the end of quarter.
PROPERTIES FOR SALE AND SOLD PROPERTIES
Q4 2024 | Condo
Properties for Sale | Number of properties listed for sale at the end of quarter. Sold Properties | Number of properties sold.
MONTHS SUPPLY OF INVENTORY
Q4 2024 | Condo
Months Supply of Inventory | Properties for sale divided by number of properties sold. Units Listed | Number of properties listed for sale at the end of month. Units Sold | Number of properties sold.
MONTHLY REPORT AVAILABLE FOR SPECIFIED CITY/AREA/NEIGHBORHOOD.
QUARTERLY REPORT AVAILABLE FOR SPECIFIED CITY/AREA/NEIGHBORHOOD.
Cities, areas, neighborhoods or property types within a county that are not represented indicate there is not enough sold data to produce a monthly or quarterly report for that specific city. If you are interested in information for a specific city, area, neighborhood and/or property type, please contact a Coldwell Banker Independent Sales Associate.
The Quarterly Report offers insight into residential real estate sales activity and regional trends. It complements the Area Report, giving you a broader look at the real estate market. If you are interested in receiving the Area Report, please let me know. I would be happy to set that up for you.
The market summary below offers a look at sales activity for the prior quarter and year, along with current and past year-to-date statistics. The graphs cover several different aspects of the real estate market. Note how some of the graphs break out trends by price increments. Please contact me if you would like more information on your current market.
Quarterly inventory of properties for sale along with number of sales
MEDIAN SALES PRICE AND NUMBER OF SALES
Q3 2024 | Single Family
Median Sales Price | Price of the “”middle”” property sold -an equal number of sales were above and below this price. Number of Sales | Number of properties sold.
AVERAGE SALES PRICE AND AVERAGE DAYS ON MARKET
Q3 2024 | Single Family
Average Sales Price | Average sales price for all properties sold. Average Days on Market | Average days on market for all properties sold.
SALES PRICE AS A PERCENTAGE OF ORIGINAL PRICE & AVERAGE DOM
Q3 2024 | Single Family
Sale Price as a Percentage of Original Price | Average sale price of property as percentage of final list price. Average Days on Market | Average days on market for all properties sold.
AVERAGE SALES PRICE AND NUMBER OF PROPERTIES FOR SALE
Q3 2024 | Single Family
Average Sales Price | Average sales price for all properties sold. Properties for Sale | Number of properties listed for sale at the end of quarter.
PROPERTIES FOR SALE AND SOLD PROPERTIES
Q3 2024 | Single Family
Properties for Sale | Number of properties listed for sale at the end of quarter. Sold Properties | Number of properties sold.
MONTHS SUPPLY OF INVENTORY
Q3 2024 | Single Family
Months Supply of Inventory | Properties for sale divided by number of properties sold. Units Listed | Number of properties listed for sale at the end of month. Units Sold | Number of properties sold.
REAL ESTATE
SNAPSHOT
ORANGE COUNTY
MARKET OVERVIEW
Q3 2024 | Condo
5.79%
PROPERTIES SOLD
Condo
6.53%
AVERAGE SOLD PRICE
Condo
3.16%
MEDIAN SOLD PRICE
Condo
26.89%
NEW LISTINGS
Condo
6.91%
AVERAGE LIST PRICE
Condo
4.77%
MEDIAN LIST PRICE
Condo
-0.15%
List/Sell Price Ratio
Condo
4.17%
AVERAGE DAYS ON MARKET
Condo
27.27%
MEDIAN DAYS ON MARKET
Condo
LISTING INVENTORY AND NUMBER OF SALES
Q3 2024 | Condo
Quarterly inventory of properties for sale along with number of sales
MEDIAN SALES PRICE AND NUMBER OF SALES
Q3 2024 | Condo
Median Sales Price | Price of the “”middle”” property sold -an equal number of sales were above and below this price. Number of Sales | Number of properties sold.
AVERAGE SALES PRICE AND AVERAGE DAYS ON MARKET
Q3 2024 | Condo
Average Sales Price | Average sales price for all properties sold. Average Days on Market | Average days on market for all properties sold.
SALES PRICE AS A PERCENTAGE OF ORIGINAL PRICE & AVERAGE DOM
Q3 2024 | Condo
Sale Price as a Percentage of Original Price | Average sale price of property as percentage of final list price. Average Days on Market | Average days on market for all properties sold.
AVERAGE SALES PRICE AND NUMBER OF PROPERTIES FOR SALE
Q3 2024 | Condo
Average Sales Price | Average sales price for all properties sold. Properties for Sale | Number of properties listed for sale at the end of quarter.
PROPERTIES FOR SALE AND SOLD PROPERTIES
Q3 2024 | Condo
Properties for Sale | Number of properties listed for sale at the end of quarter. Sold Properties | Number of properties sold.
MONTHS SUPPLY OF INVENTORY
Q3 2024 | Condo
Months Supply of Inventory | Properties for sale divided by number of properties sold. Units Listed | Number of properties listed for sale at the end of month. Units Sold | Number of properties sold.
MONTHLY REPORT AVAILABLE FOR SPECIFIED CITY/AREA/NEIGHBORHOOD.
QUARTERLY REPORT AVAILABLE FOR SPECIFIED CITY/AREA/NEIGHBORHOOD.
Cities, areas, neighborhoods or property types within a county that are not represented indicate there is not enough sold data to produce a monthly or quarterly report for that specific city. If you are interested in information for a specific city, area, neighborhood and/or property type, please contact a Coldwell Banker Independent Sales Associate.
The Quarterly Report offers insight into residential real estate sales activity and regional trends. It complements the Area Report, giving you a broader look at the real estate market. If you are interested in receiving the Area Report, please let me know. I would be happy to set that up for you.
The market summary below offers a look at sales activity for the prior quarter and year, along with current and past year-to-date statistics. The graphs cover several different aspects of the real estate market. Note how some of the graphs break out trends by price increments. Please contact me if you would like more information on your current market.
Quarterly inventory of properties for sale along with number of sales
MEDIAN SALES PRICE AND NUMBER OF SALES
Q2 2024 | Single Family
Median Sales Price | Price of the “”middle”” property sold -an equal number of sales were above and below this price. Number of Sales | Number of properties sold.
AVERAGE SALES PRICE AND AVERAGE DAYS ON MARKET
Q2 2024 | Single Family
Average Sales Price | Average sales price for all properties sold. Average Days on Market | Average days on market for all properties sold.
SALES PRICE AS A PERCENTAGE OF ORIGINAL PRICE & AVERAGE DOM
Q2 2024 | Single Family
Sale Price as a Percentage of Original Price | Average sale price of property as percentage of final list price. Average Days on Market | Average days on market for all properties sold.
AVERAGE SALES PRICE AND NUMBER OF PROPERTIES FOR SALE
Q2 2024 | Single Family
Average Sales Price | Average sales price for all properties sold. Properties for Sale | Number of properties listed for sale at the end of quarter.
PROPERTIES FOR SALE AND SOLD PROPERTIES
Q2 2024 | Single Family
Properties for Sale | Number of properties listed for sale at the end of quarter. Sold Properties | Number of properties sold.
MONTHS SUPPLY OF INVENTORY
Q2 2024 | Single Family
Months Supply of Inventory | Properties for sale divided by number of properties sold. Units Listed | Number of properties listed for sale at the end of month. Units Sold | Number of properties sold.
REAL ESTATE
SNAPSHOT
ORANGE COUNTY
MARKET OVERVIEW
Q2 2024 | Condo
0.72%
PROPERTIES SOLD
Condo
10.90%
AVERAGE SOLD PRICE
Condo
9.91%
MEDIAN SOLD PRICE
Condo
15.11%
NEW LISTINGS
Condo
9.87%
AVERAGE LIST PRICE
Condo
8.90%
MEDIAN LIST PRICE
Condo
0.79%
List/Sell Price Ratio
Condo
-20.69%
AVERAGE DAYS ON MARKET
Condo
-16.67%
MEDIAN DAYS ON MARKET
Condo
LISTING INVENTORY AND NUMBER OF SALES
Q2 2024 | Condo
Quarterly inventory of properties for sale along with number of sales
MEDIAN SALES PRICE AND NUMBER OF SALES
Q2 2024 | Condo
Median Sales Price | Price of the “”middle”” property sold -an equal number of sales were above and below this price. Number of Sales | Number of properties sold.
AVERAGE SALES PRICE AND AVERAGE DAYS ON MARKET
Q2 2024 | Condo
Average Sales Price | Average sales price for all properties sold. Average Days on Market | Average days on market for all properties sold.
SALES PRICE AS A PERCENTAGE OF ORIGINAL PRICE & AVERAGE DOM
Q2 2024 | Condo
Sale Price as a Percentage of Original Price | Average sale price of property as percentage of final list price. Average Days on Market | Average days on market for all properties sold.
AVERAGE SALES PRICE AND NUMBER OF PROPERTIES FOR SALE
Q2 2024 | Condo
Average Sales Price | Average sales price for all properties sold. Properties for Sale | Number of properties listed for sale at the end of quarter.
PROPERTIES FOR SALE AND SOLD PROPERTIES
Q2 2024 | Condo
Properties for Sale | Number of properties listed for sale at the end of quarter. Sold Properties | Number of properties sold.
MONTHS SUPPLY OF INVENTORY
Q2 2024 | Condo
Months Supply of Inventory | Properties for sale divided by number of properties sold. Units Listed | Number of properties listed for sale at the end of month. Units Sold | Number of properties sold.
MONTHLY REPORT AVAILABLE FOR SPECIFIED CITY/AREA/NEIGHBORHOOD.
QUARTERLY REPORT AVAILABLE FOR SPECIFIED CITY/AREA/NEIGHBORHOOD.
Cities, areas, neighborhoods or property types within a county that are not represented indicate there is not enough sold data to produce a monthly or quarterly report for that specific city. If you are interested in information for a specific city, area, neighborhood and/or property type, please contact a Coldwell Banker Independent Sales Associate.
The Quarterly Report offers insight into residential real estate sales activity and regional trends. It complements the Area Report, giving you a broader look at the real estate market. If you are interested in receiving the Area Report, please let me know. I would be happy to set that up for you.
The market summary below offers a look at sales activity for the prior quarter and year, along with current and past year-to-date statistics. The graphs cover several different aspects of the real estate market. Note how some of the graphs break out trends by price increments. Please contact me if you would like more information on your current market.
Quarterly inventory of properties for sale along with number of sales
MEDIAN SALES PRICE AND NUMBER OF SALES
Q1 2024 | Single Family
Median Sales Price | Price of the “”middle”” property sold -an equal number of sales were above and below this price. Number of Sales | Number of properties sold.
AVERAGE SALES PRICE AND AVERAGE DAYS ON MARKET
Q1 2024 | Single Family
Average Sales Price | Average sales price for all properties sold. Average Days on Market | Average days on market for all properties sold.
SALES PRICE AS A PERCENTAGE OF ORIGINAL PRICE & AVERAGE DOM
Q1 2024 | Single Family
Sale Price as a Percentage of Original Price | Average sale price of property as percentage of final list price. Average Days on Market | Average days on market for all properties sold.
AVERAGE SALES PRICE AND NUMBER OF PROPERTIES FOR SALE
Q1 2024 | Single Family
Average Sales Price | Average sales price for all properties sold. Properties for Sale | Number of properties listed for sale at the end of quarter.
PROPERTIES FOR SALE AND SOLD PROPERTIES
Q1 2024 | Single Family
Properties for Sale | Number of properties listed for sale at the end of quarter. Sold Properties | Number of properties sold.
MONTHS SUPPLY OF INVENTORY
Q1 2024 | Single Family
Months Supply of Inventory | Properties for sale divided by number of properties sold. Units Listed | Number of properties listed for sale at the end of month. Units Sold | Number of properties sold.
REAL ESTATE
SNAPSHOT
ORANGE COUNTY
MARKET OVERVIEW
Q1 2024 | Condo
10.35%
PROPERTIES SOLD
CONDO
13.23%
AVERAGE SOLD PRICE
CONDO
9.15%
MEDIAN SOLD PRICE
CONDO
8.61%
NEW LISTINGS
CONDO
11.29%
AVERAGE LIST PRICE
CONDO
6.34%
MEDIAN LIST PRICE
CONDO
1.69%
LIST/SELL PRICE RATIO
CONDO
-30.95%
AVERAGE DAYS ON MARKET
CONDO
-51.85%
MEDIAN DAYS ON MARKET
CONDO
LISTING INVENTORY AND NUMBER OF SALES
Q1 2024 | Condo
Quarterly inventory of properties for sale along with number of sales
MEDIAN SALES PRICE AND NUMBER OF SALES
Q1 2024 | Condo
Median Sales Price | Price of the “”middle”” property sold -an equal number of sales were above and below this price. Number of Sales | Number of properties sold.
AVERAGE SALES PRICE AND AVERAGE DAYS ON MARKET
Q1 2024 | Condo
Average Sales Price | Average sales price for all properties sold. Average Days on Market | Average days on market for all properties sold.
SALES PRICE AS A PERCENTAGE OF ORIGINAL PRICE & AVERAGE DOM
Q1 2024 | Condo
Sale Price as a Percentage of Original Price | Average sale price of property as percentage of final list price. Average Days on Market | Average days on market for all properties sold.
AVERAGE SALES PRICE AND NUMBER OF PROPERTIES FOR SALE
Q1 2024 | Condo
Average Sales Price | Average sales price for all properties sold. Properties for Sale | Number of properties listed for sale at the end of quarter.
PROPERTIES FOR SALE AND SOLD PROPERTIES
Q1 2024 | Condo
Properties for Sale | Number of properties listed for sale at the end of quarter. Sold Properties | Number of properties sold.
MONTHS SUPPLY OF INVENTORY
Q1 2024 | Condo
Months Supply of Inventory | Properties for sale divided by number of properties sold. Units Listed | Number of properties listed for sale at the end of month. Units Sold | Number of properties sold.
MONTHLY REPORT AVAILABLE FOR SPECIFIED CITY/AREA/NEIGHBORHOOD.
QUARTERLY REPORT AVAILABLE FOR SPECIFIED CITY/AREA/NEIGHBORHOOD.
Cities, areas, neighborhoods or property types within a county that are not represented indicate there is not enough sold data to produce a monthly or quarterly report for that specific city. If you are interested in information for a specific city, area, neighborhood and/or property type, please contact a Coldwell Banker Independent Sales Associate.