

 Facebook
 X
X
 Pinterest
 Copy Link

 My observations of Huntington Beach real estate market conditions allow me to provide valuable insights to home buyers & sellers.
If you have a minute, allow me to point out the trends and conditions that drove the real estate market over the last 10 years.
Days of Supply is defined as the number of days it would take to sell every home presently on the market at the current rate of sales if no new listings came on the market.
It is the metric which provides the best indication of the overall strength of the real estate market, and I have been tracking it closely for many years.
- When Days of Supply is “high”, this means that there are a lot of homes on the market relative to the number of homes selling. We consider a level 120 or greater to be a Strong Buyer’s Market.
- When Days of Supply is “low”, this means that there are few homes on the market relative to the number of homes selling. We consider a level of 60 or below to be a Strong Seller’s Market.
Take a look at the below graph. I will walk you through market conditions from 2014 to February 2024.
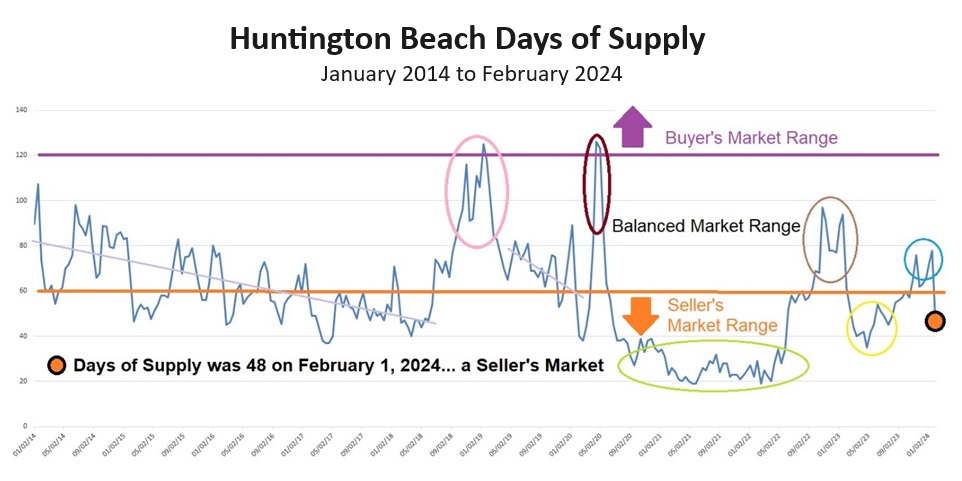
- From 2014 through 2018, the market saw a general strengthening as shown by the light purple regression line. The mean level of Days of Supply fell from 80 (Balanced Market) to 50 (Strong Seller’s Market).
- The pink oval shows the Days of Supply peaked at 125 (Buyer’s Market) on January 10, 2019 due to a combination of the elimination of the Mortgage Interest Tax Deduction and an increase in mortgage rates to 4.94% in November 2018.
- From February 2019 to February 2020 (just prior to CV-19) the light purple regression line shows market conditions improved rapidly with the level of Days of Supply falling to just 40 (Strong Seller’s Market).
- At the inception of the CV-19 shut down, the dark red oval shows Days of Supply spiked at 126; however, as interest rates fell and consumers looked to relocate during the pandemic, the Days of Supply plummeted back to 40 (Strong Seller’s Market).
- From July 2020 to May 2022 the green oval shows the Days of Supply hovered between 18 and 38… this was the strongest seller’s market on record. Most likely the strongest imbalance between supply and demand which will ever be seen in our lifetimes. Huntington Beach was seen as an ideal remote work location, interest rates were low, and government stimulus programs put billions of dollars into the economy. Just about every home had multiple offers, and many sold for thousands of dollars above the asking price.
- Then… in the Spring of 2022 mortgage interest rates went up over two percent! From June 2022 to February 2023, the dark green oval shows the Days of Supply into the 60 to 97 range. It was a Buyer’s Market in the $2 Million+ price segments and balanced market conditions down into the $800,000 to $1,200,000 range. Mortgage rates rose steadily spiking to 7.08% in November of 2022, and then dropped to 6.13% by February 2023.
- These low rates in the Spring of 2023, allowed the Days of Supply to fall back to the 35 to 55 range (Strong Seller’s Market) range March and August, see Yellow Circle.
- Then mortgage rates began rising once again and peaked just over 8% in October 2023. The aqua blue circle shows the Days of Supply responded as expected reaching 78 on January 18, 2024.
- Favorable inflation reports and a pause in the increase of interest rates by the Federal Reserve in November 2023 resulted in mortgage rates plunging over 150 basis points. The result was an increase in buyer purchasing power and activity. Predictably, the Days of Supply dropped back to 48 on February 1, 2024 (Strong Seller’s Market).
Here is what we know from the fluctuations in Days of Supply and Home Price Appreciation when the metric hits highs & lows:
When Days of Supply reaches the 90 range, we see home prices softening (falling in some cases). And, when the Days of Supply falls well below the 60 mark, we observe home prices increasing. When Days of Supply was between 18 and 40, we saw double digit home price appreciation, multiple offers, and homes being bid up well above asking prices.
None of us has a crystal ball, and Days of Supply varies in both price segments and within neighborhoods for a variety of reasons. The ability of your Realtor to do an ongoing analysis of Days of Supply in your neighborhood should be a very strong consideration in who you select to market your home.
Knowing which way the market is trending while selecting a list price or reviewing offers is essential for home sellers looking to maximize their equity.
If you are having thoughts about selling your home or investment property, I can be reached at 714-336-0394
