

 Facebook
 X
X
 Pinterest
 Copy Link
 January 9, 2025 | 714-336-0394 | Scot@CampbellRealtors.com | Broker of Record – Coldwell Banker-Campbell Realtors
Choosing the Right Home for Your Golden Years in Huntington Beach involves several considerations, and a little extra time thinking about what is most important to you will help determine the ideal location, neighborhood, and features.
Retirement is a time to enjoy life—whether that means taking up new hobbies, spending more time with family, or simply relaxing. If you’re considering where to spend your golden years, Huntington Beach offers a unique combination of coastal beauty, vibrant communities, and access to essential amenities. Here are some important factors to consider when choosing your retirement home.
Financial Considerations for Retirees
While you might still be working now, transitioning to a fixed income in retirement means financial planning is crucial. Before you start searching for homes in Huntington Beach or elsewhere, meet with a financial planner to establish a realistic budget. Consider:
- Mortgage Payments: If you’re buying, ensure your monthly payments fit comfortably within your retirement income. If you can find the right home, it is wise to have zero debt.
- Property Taxes: Huntington Beach offers stunning homes, weather, and recreational opportunities. Our property tax rate is just under 1.1%, which is very low compared to many other areas of Orange County. Per Proposition 13, your taxes cannot exceed 2% increase per year.
- Ongoing Maintenance Costs: Plan for routine expenses like landscaping, utilities, and home repairs, which can add up over time. Unlike property taxes, these expenses can go up 5% – 10% per year.
By setting financial boundaries early, you’ll avoid becoming burdened by housing costs during retirement.
Prioritizing Location
Where you live in your retirement years will greatly influence your quality of life. Huntington Beach offers sunny weather, access to healthcare, and recreational opportunities that make it a great choice for retirees. Here are key considerations:
- Proximity to Family and Friends: Consider how close you want to be to loved ones. Being near a support system can be invaluable as you age.
- Access to Hobbies and Activities: Huntington Beach has a wealth of recreational opportunities, from biking along the coast, to community events downtown, to activities at the Central Park Senior Center. Choose a location that aligns with your interests.
- Healthcare Access: Ensure your home is near top-tier medical facilities and specialists. Huntington Beach’s proximity to Orange County’s healthcare network is a significant advantage for retirees.
- Weather Preparedness: Huntington Beach boasts mild, sunny weather year-round, minimizing risks associated with extreme weather.
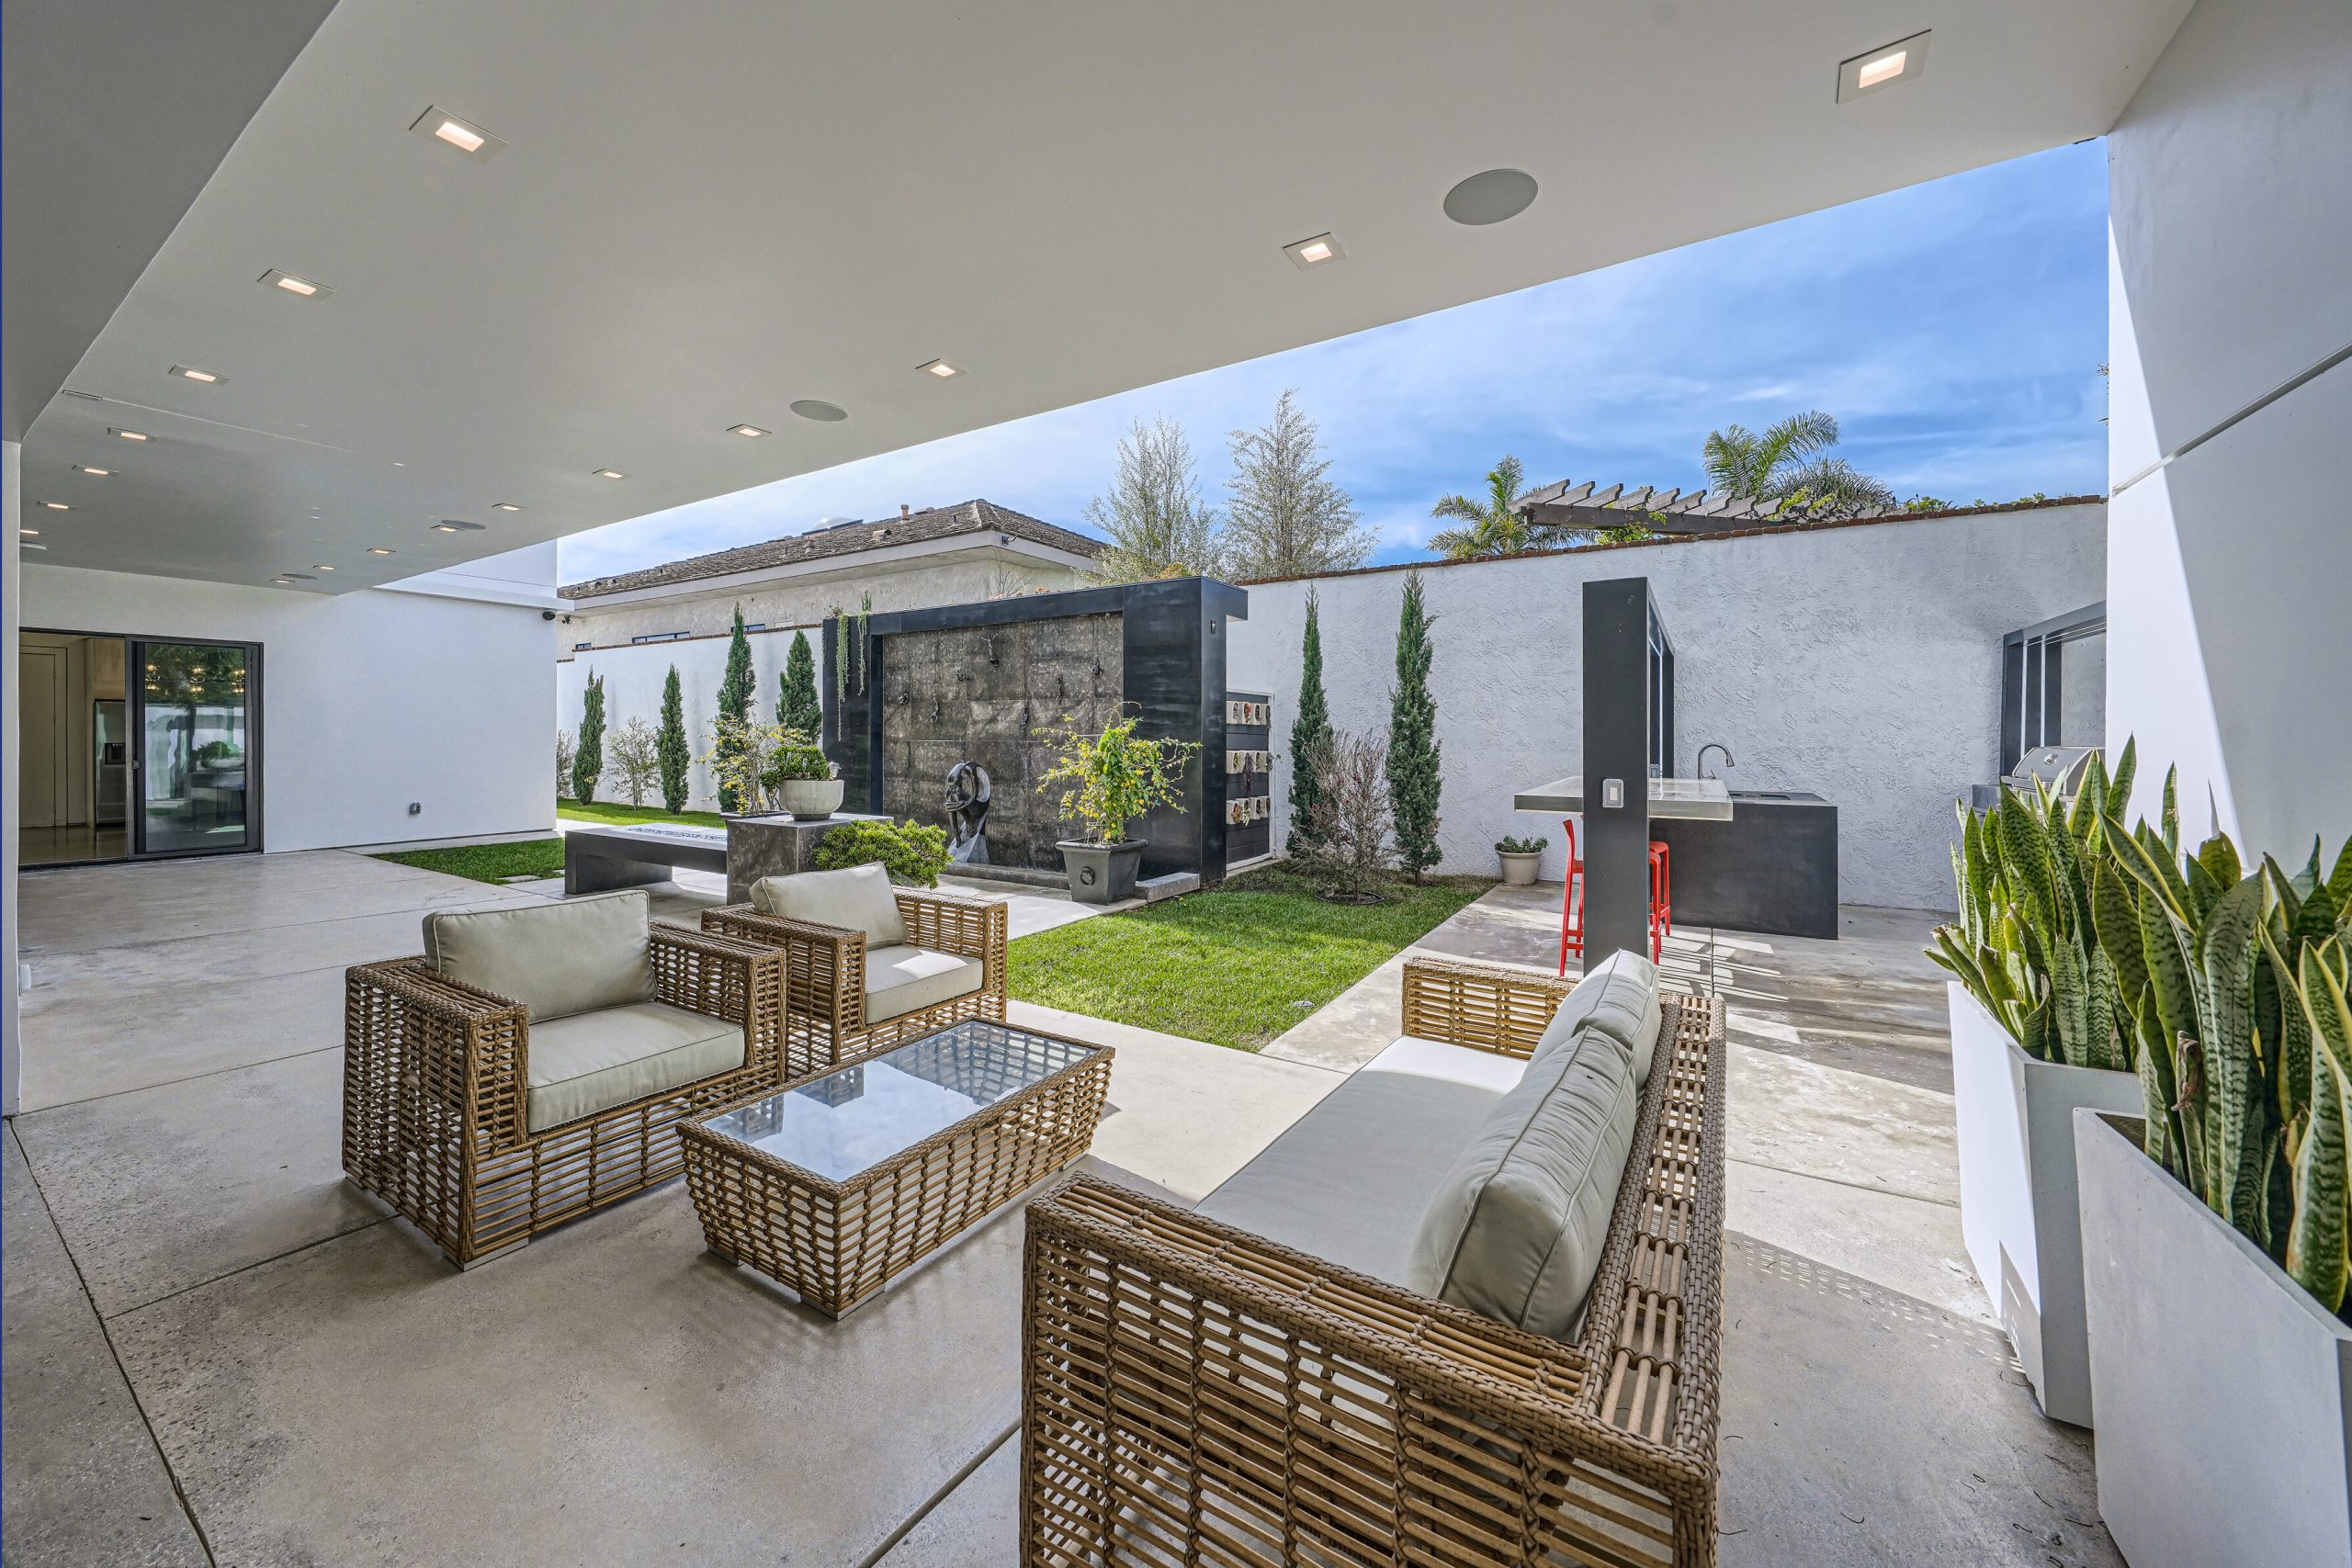
Selecting the Right Home
Your retirement home should be practical and future-proofed for changing needs. Here are features to prioritize:
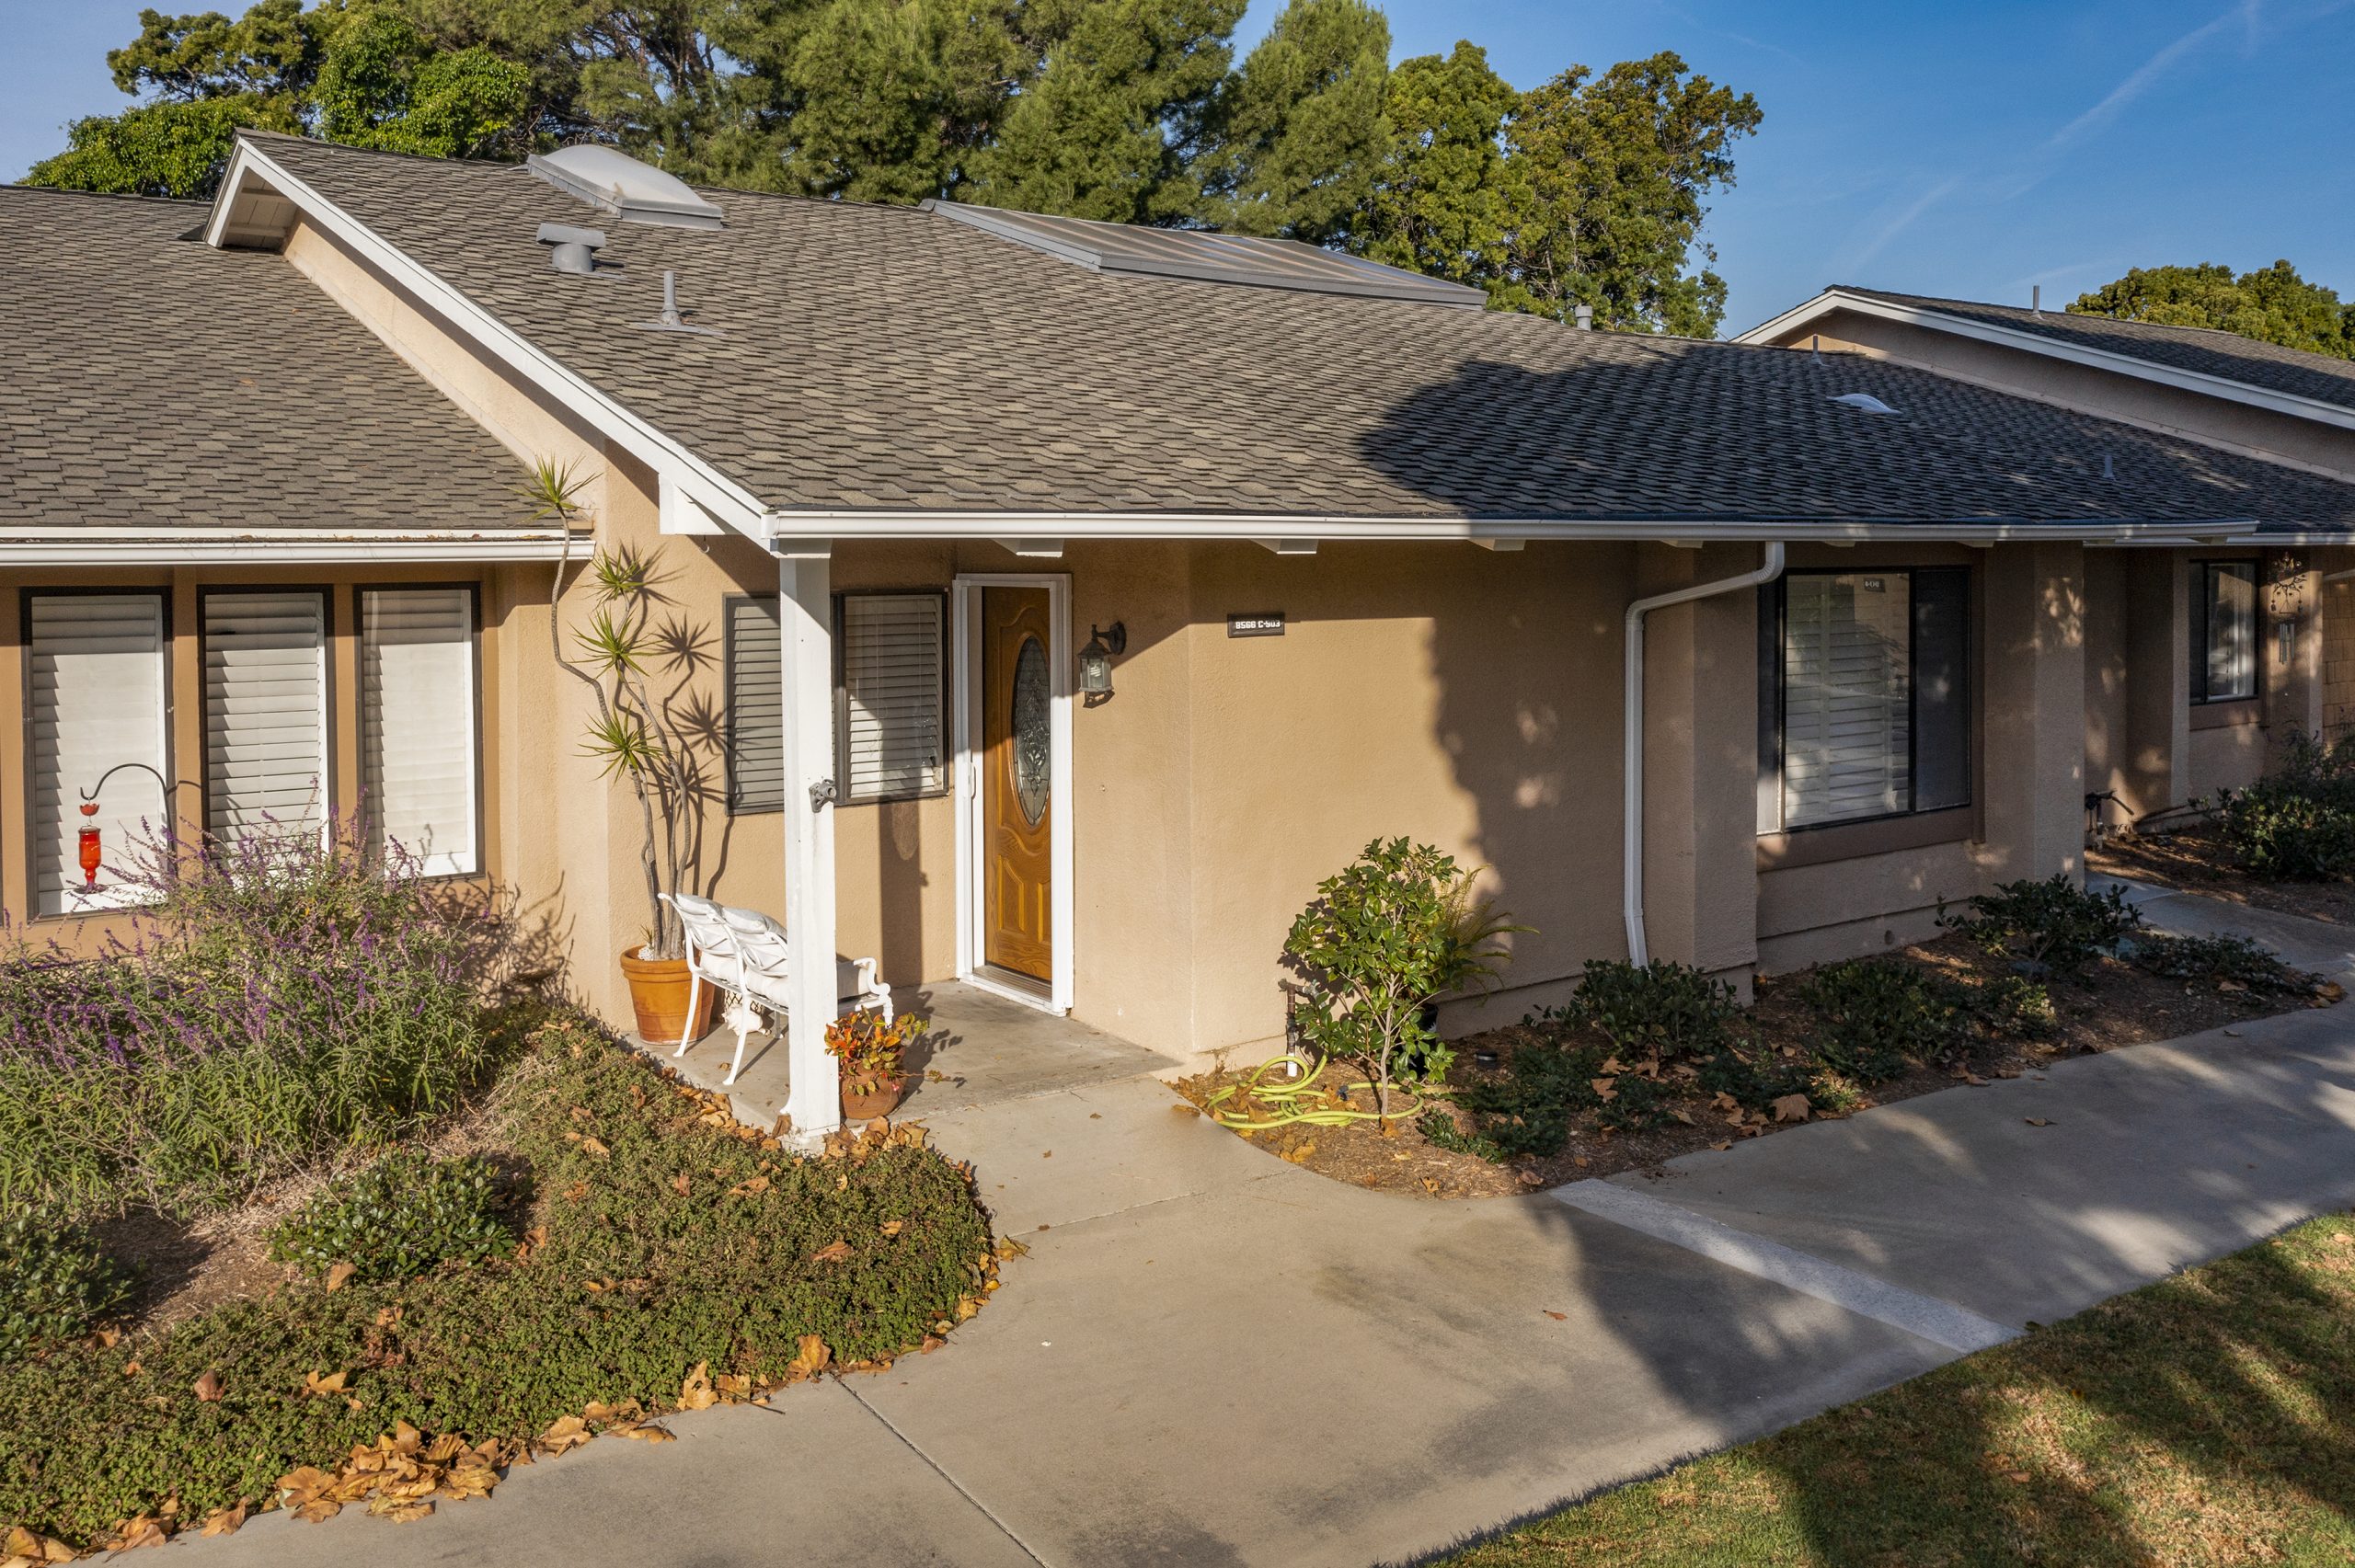
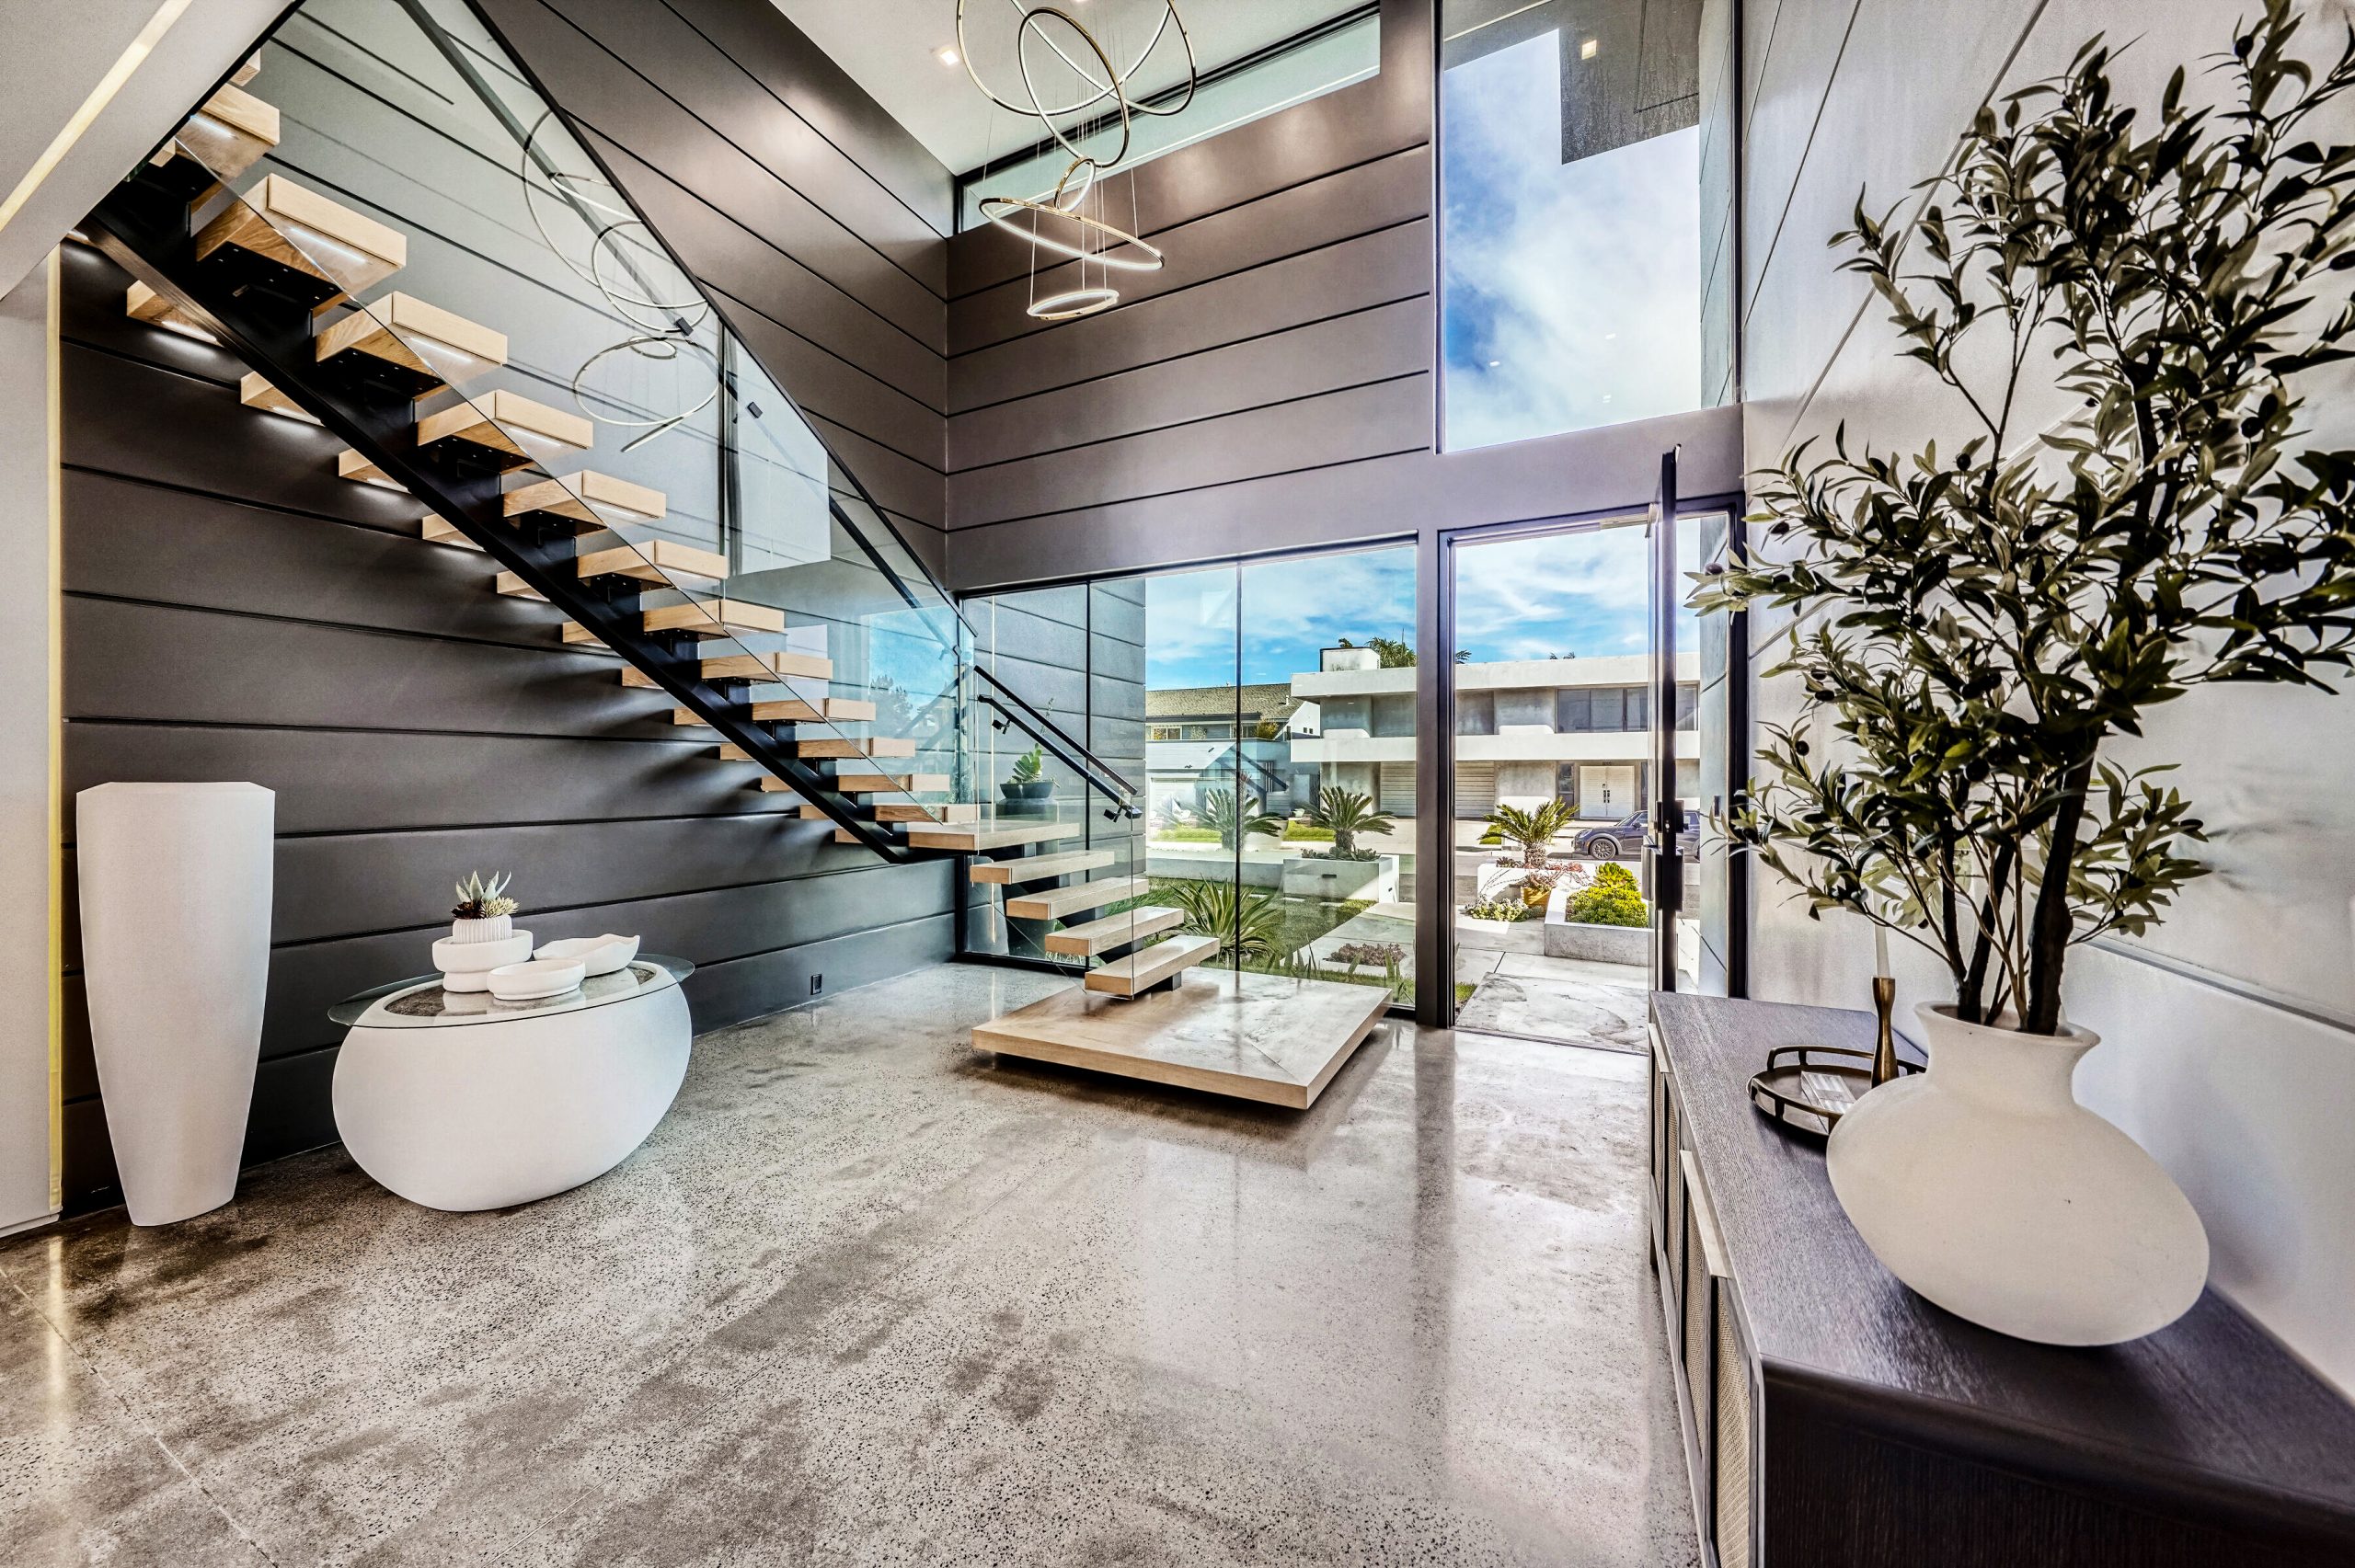
- Single-Story Living: Homes without stairs are easier to navigate as mobility decreases.
- Accessible Design: Look for wide hallways, spacious bathrooms, and entryways that can accommodate wheelchairs or walkers if needed.
- Low Maintenance: Smaller homes with manageable yards or low-maintenance landscaping are ideal for retirees who want to spend less time on upkeep.
- Energy Efficiency: Newer homes with energy-efficient features can reduce utility costs, leaving more money for leisure activities.
If you envision aging in place, consider modifications like grab bars, zero-step showers, or ramps to make your home safer and more comfortable as you grow older.
Exploring Retirement Communities
For retirees seeking a built-in social network and accessible care options, retirement communities can be an excellent choice. Huntington Beach offers several communities that cater to different needs:
- Downtown Huntington Beach has single level cottages which were built from 1900 to 1950. They come up for sale occasionally. They are only about 800 to 1200 square feet with lots in the 3000 square foot range. These “beach close” homes represent a “less is more” lifestyle with access to recreation, shops, and restaurants very nearby.
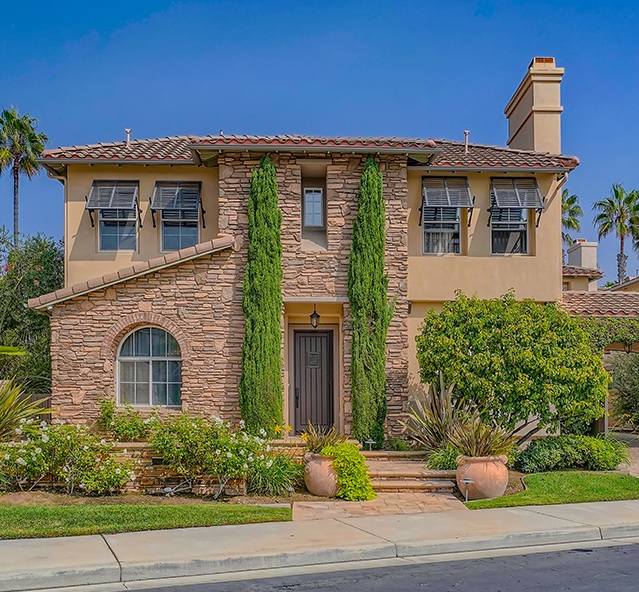
- Much of inland Huntington Beach homes built in the 1960 and early 1970s were single story homes from 1200 to 1500 square feet. The lots are typically 5000 to 6500 square feet. These homes are not necessarily walking distance to the beach and recreation, but they offer nice surroundings for retirees who do not want attached housing and would like some yard space.
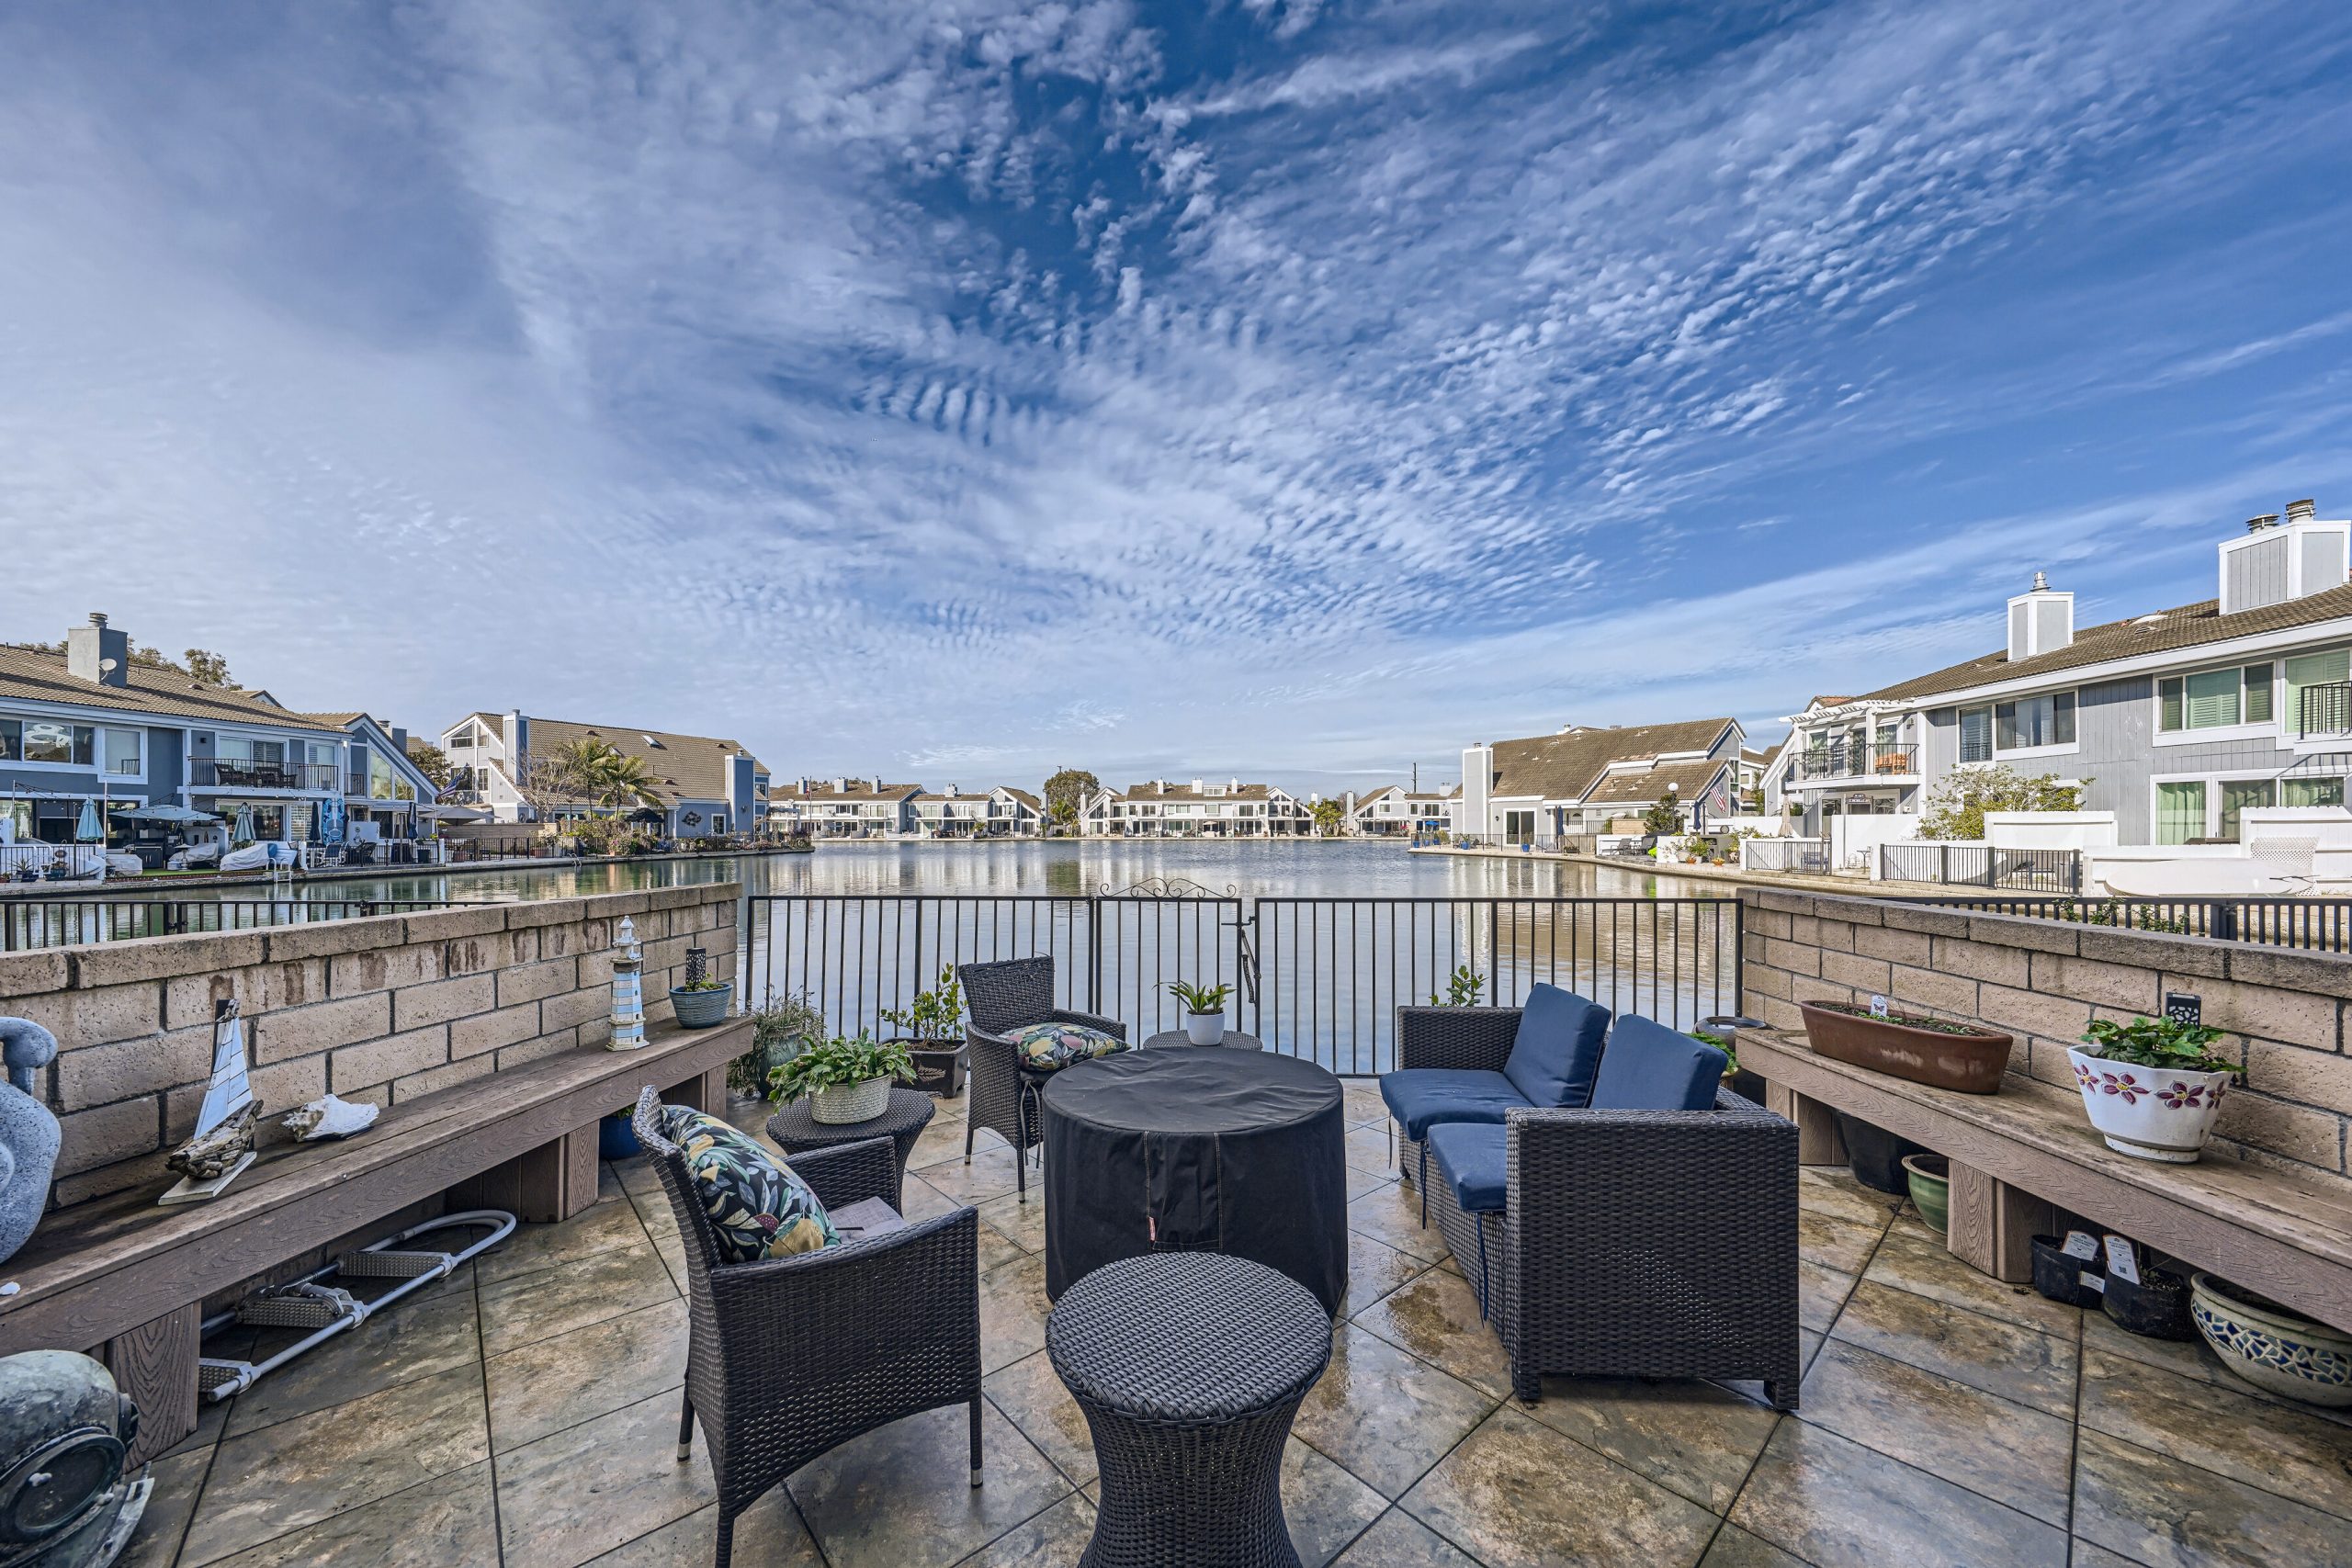
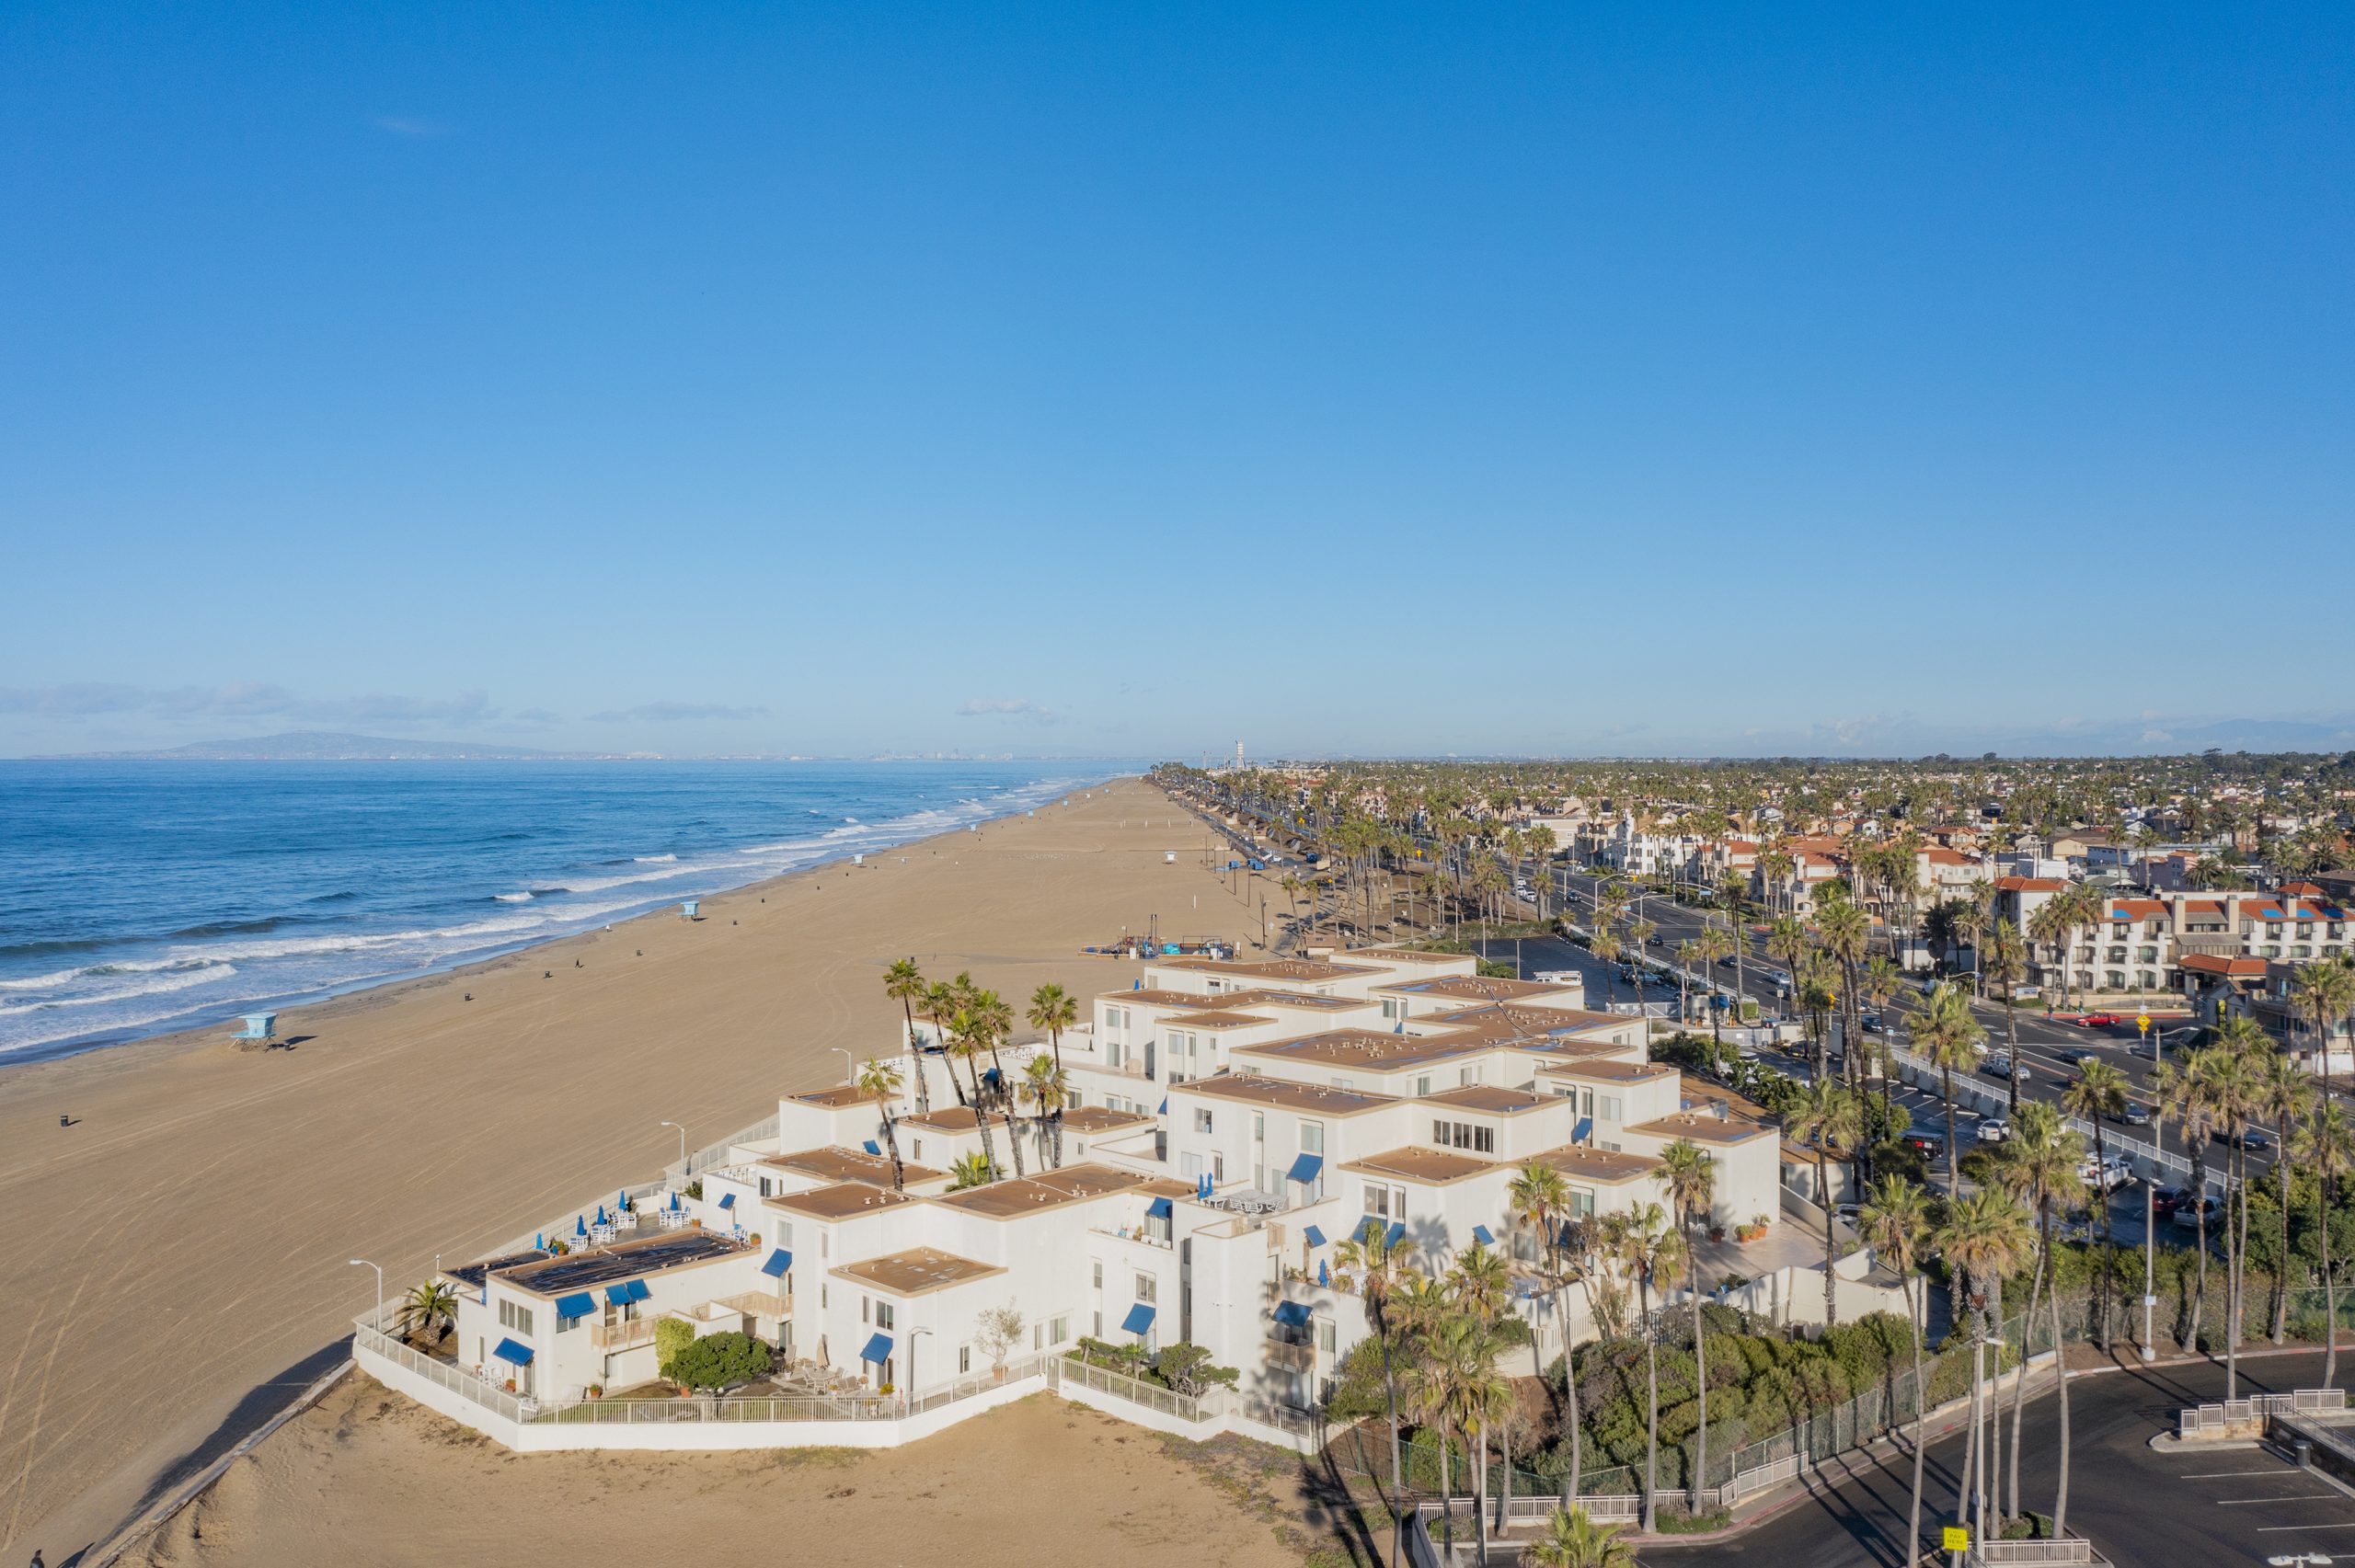
- There are several stacked flat style condominium buildings with elevators in the Downtown Huntington Beach and Huntington Harbour areas. These developments are for residents of all ages, and offer one level living combined with access to recreational opportunities.
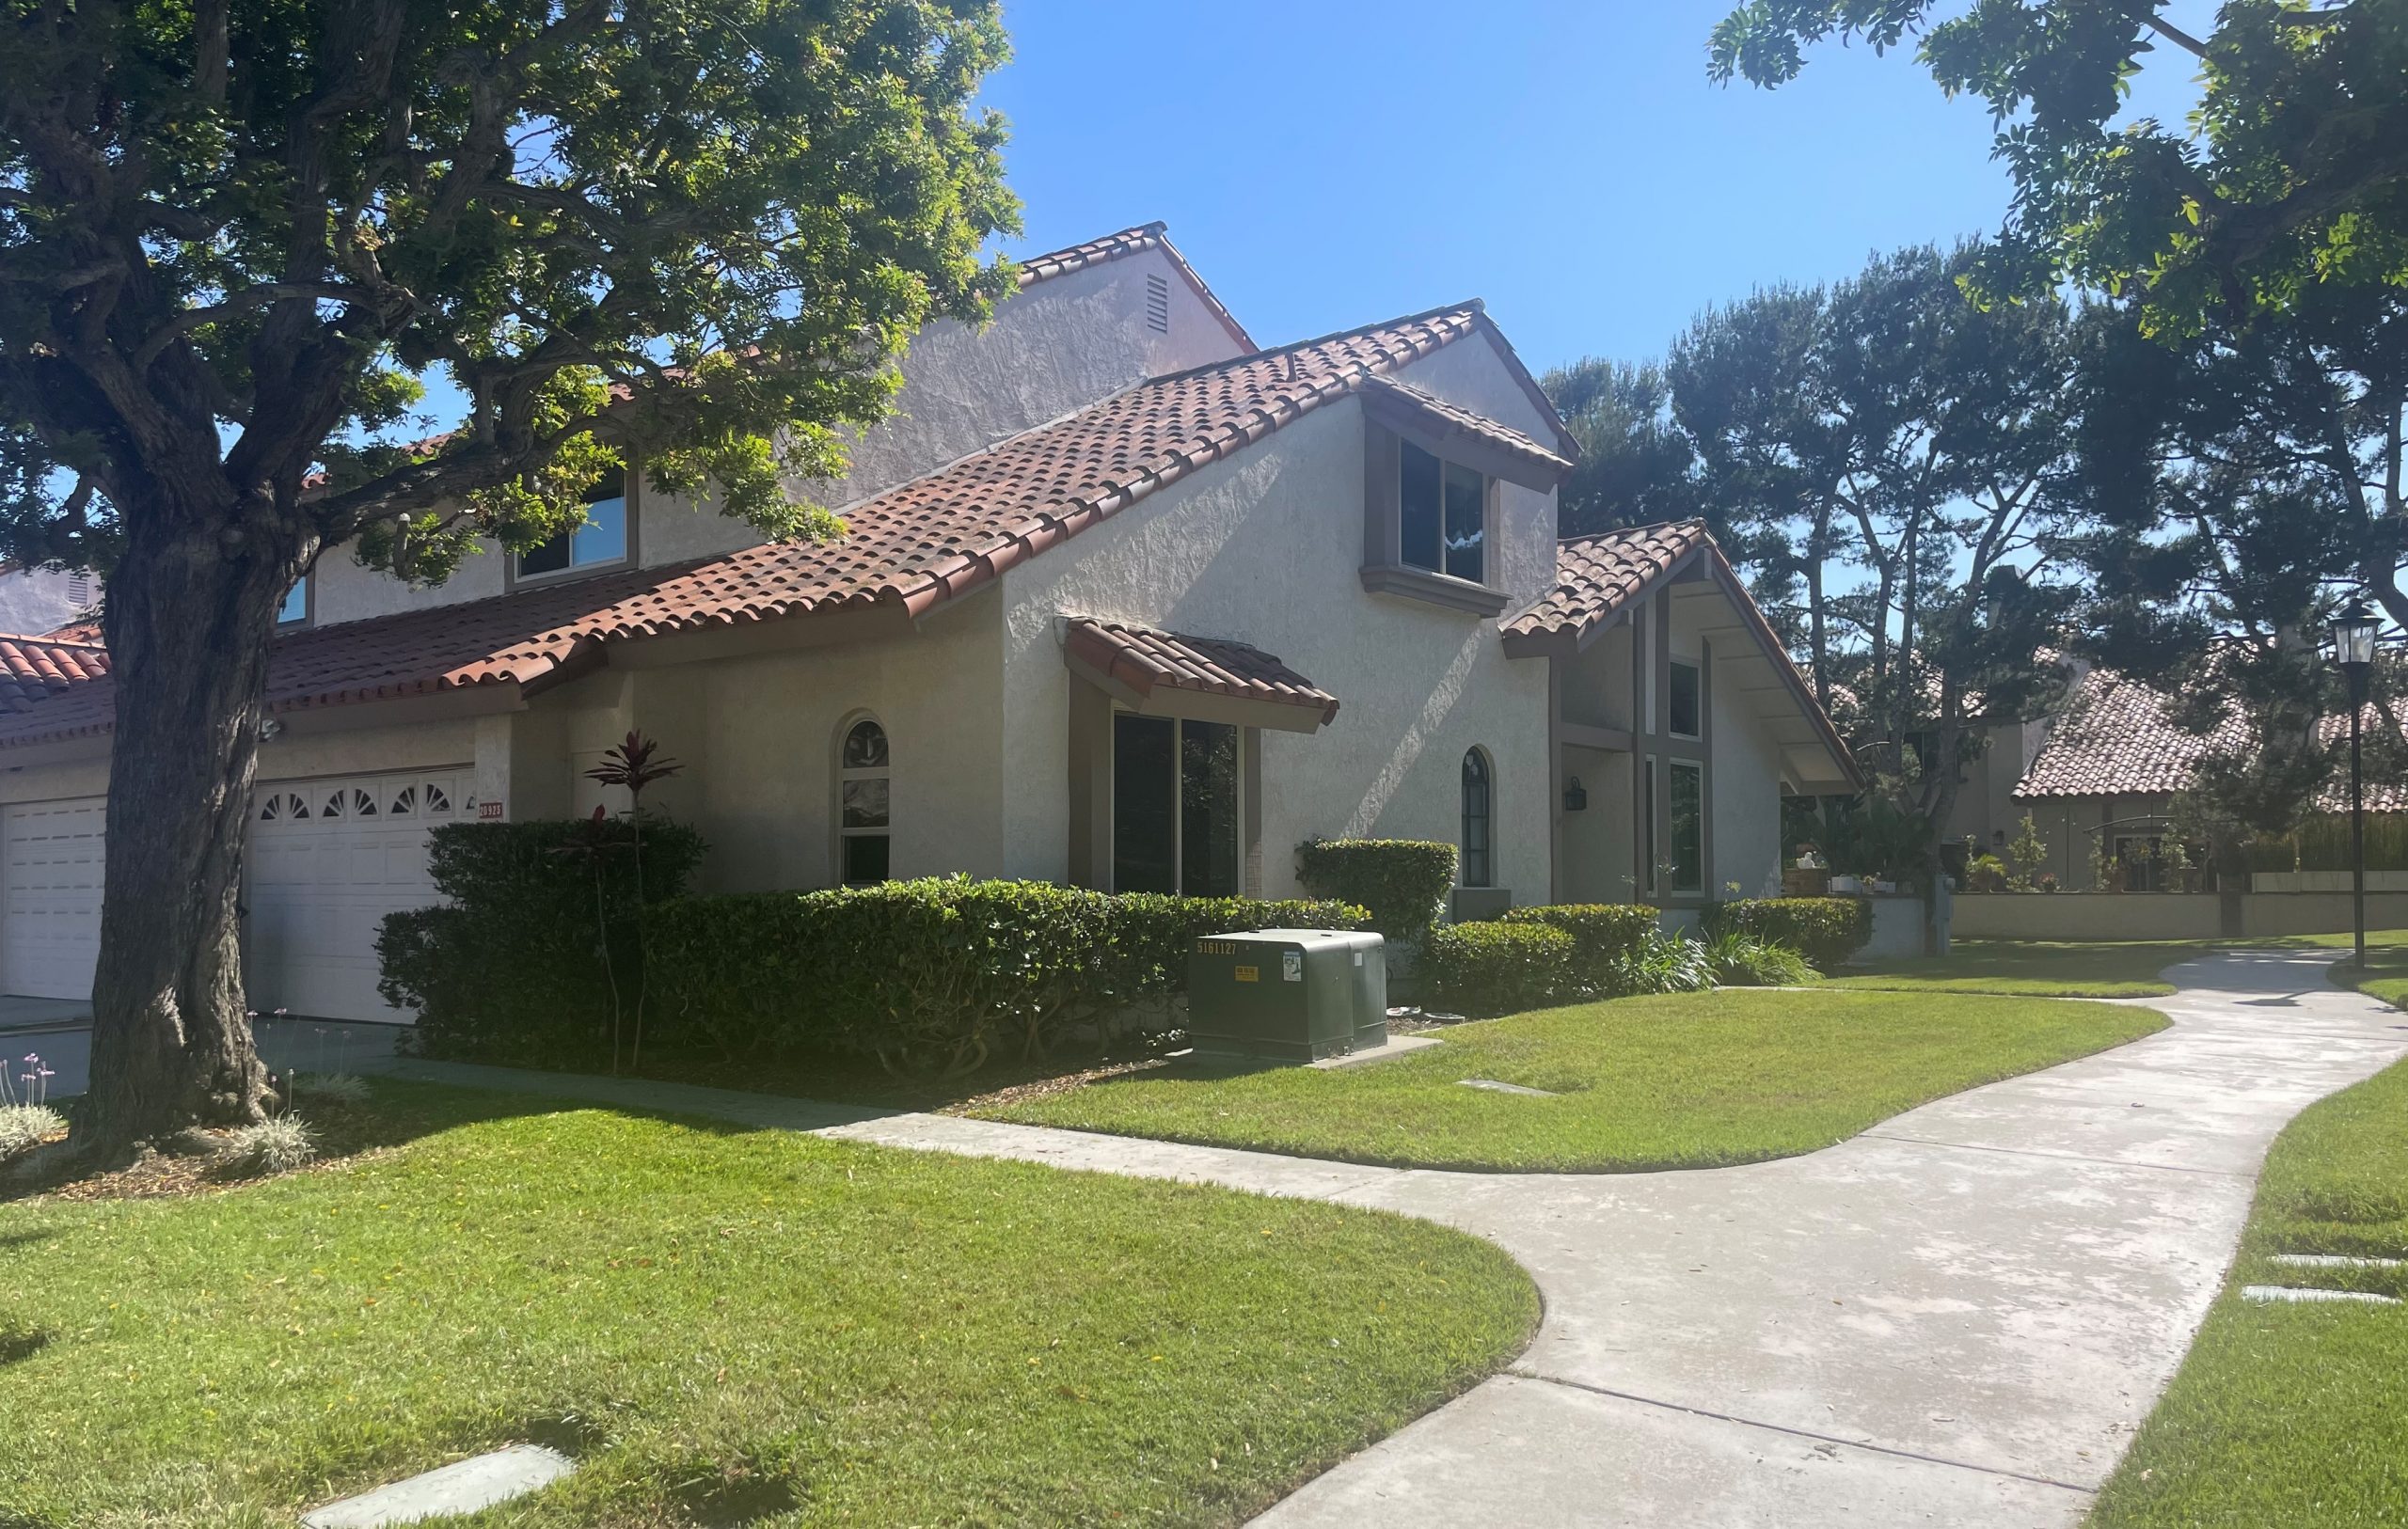
- Spreadout through Huntington Beach there are several townhouse developments which have one level units with no one above or below. Examples include: Beachwalk, La Cuesta by the Sea, La Cuesta Villas, Landmark Yorktown, and others.
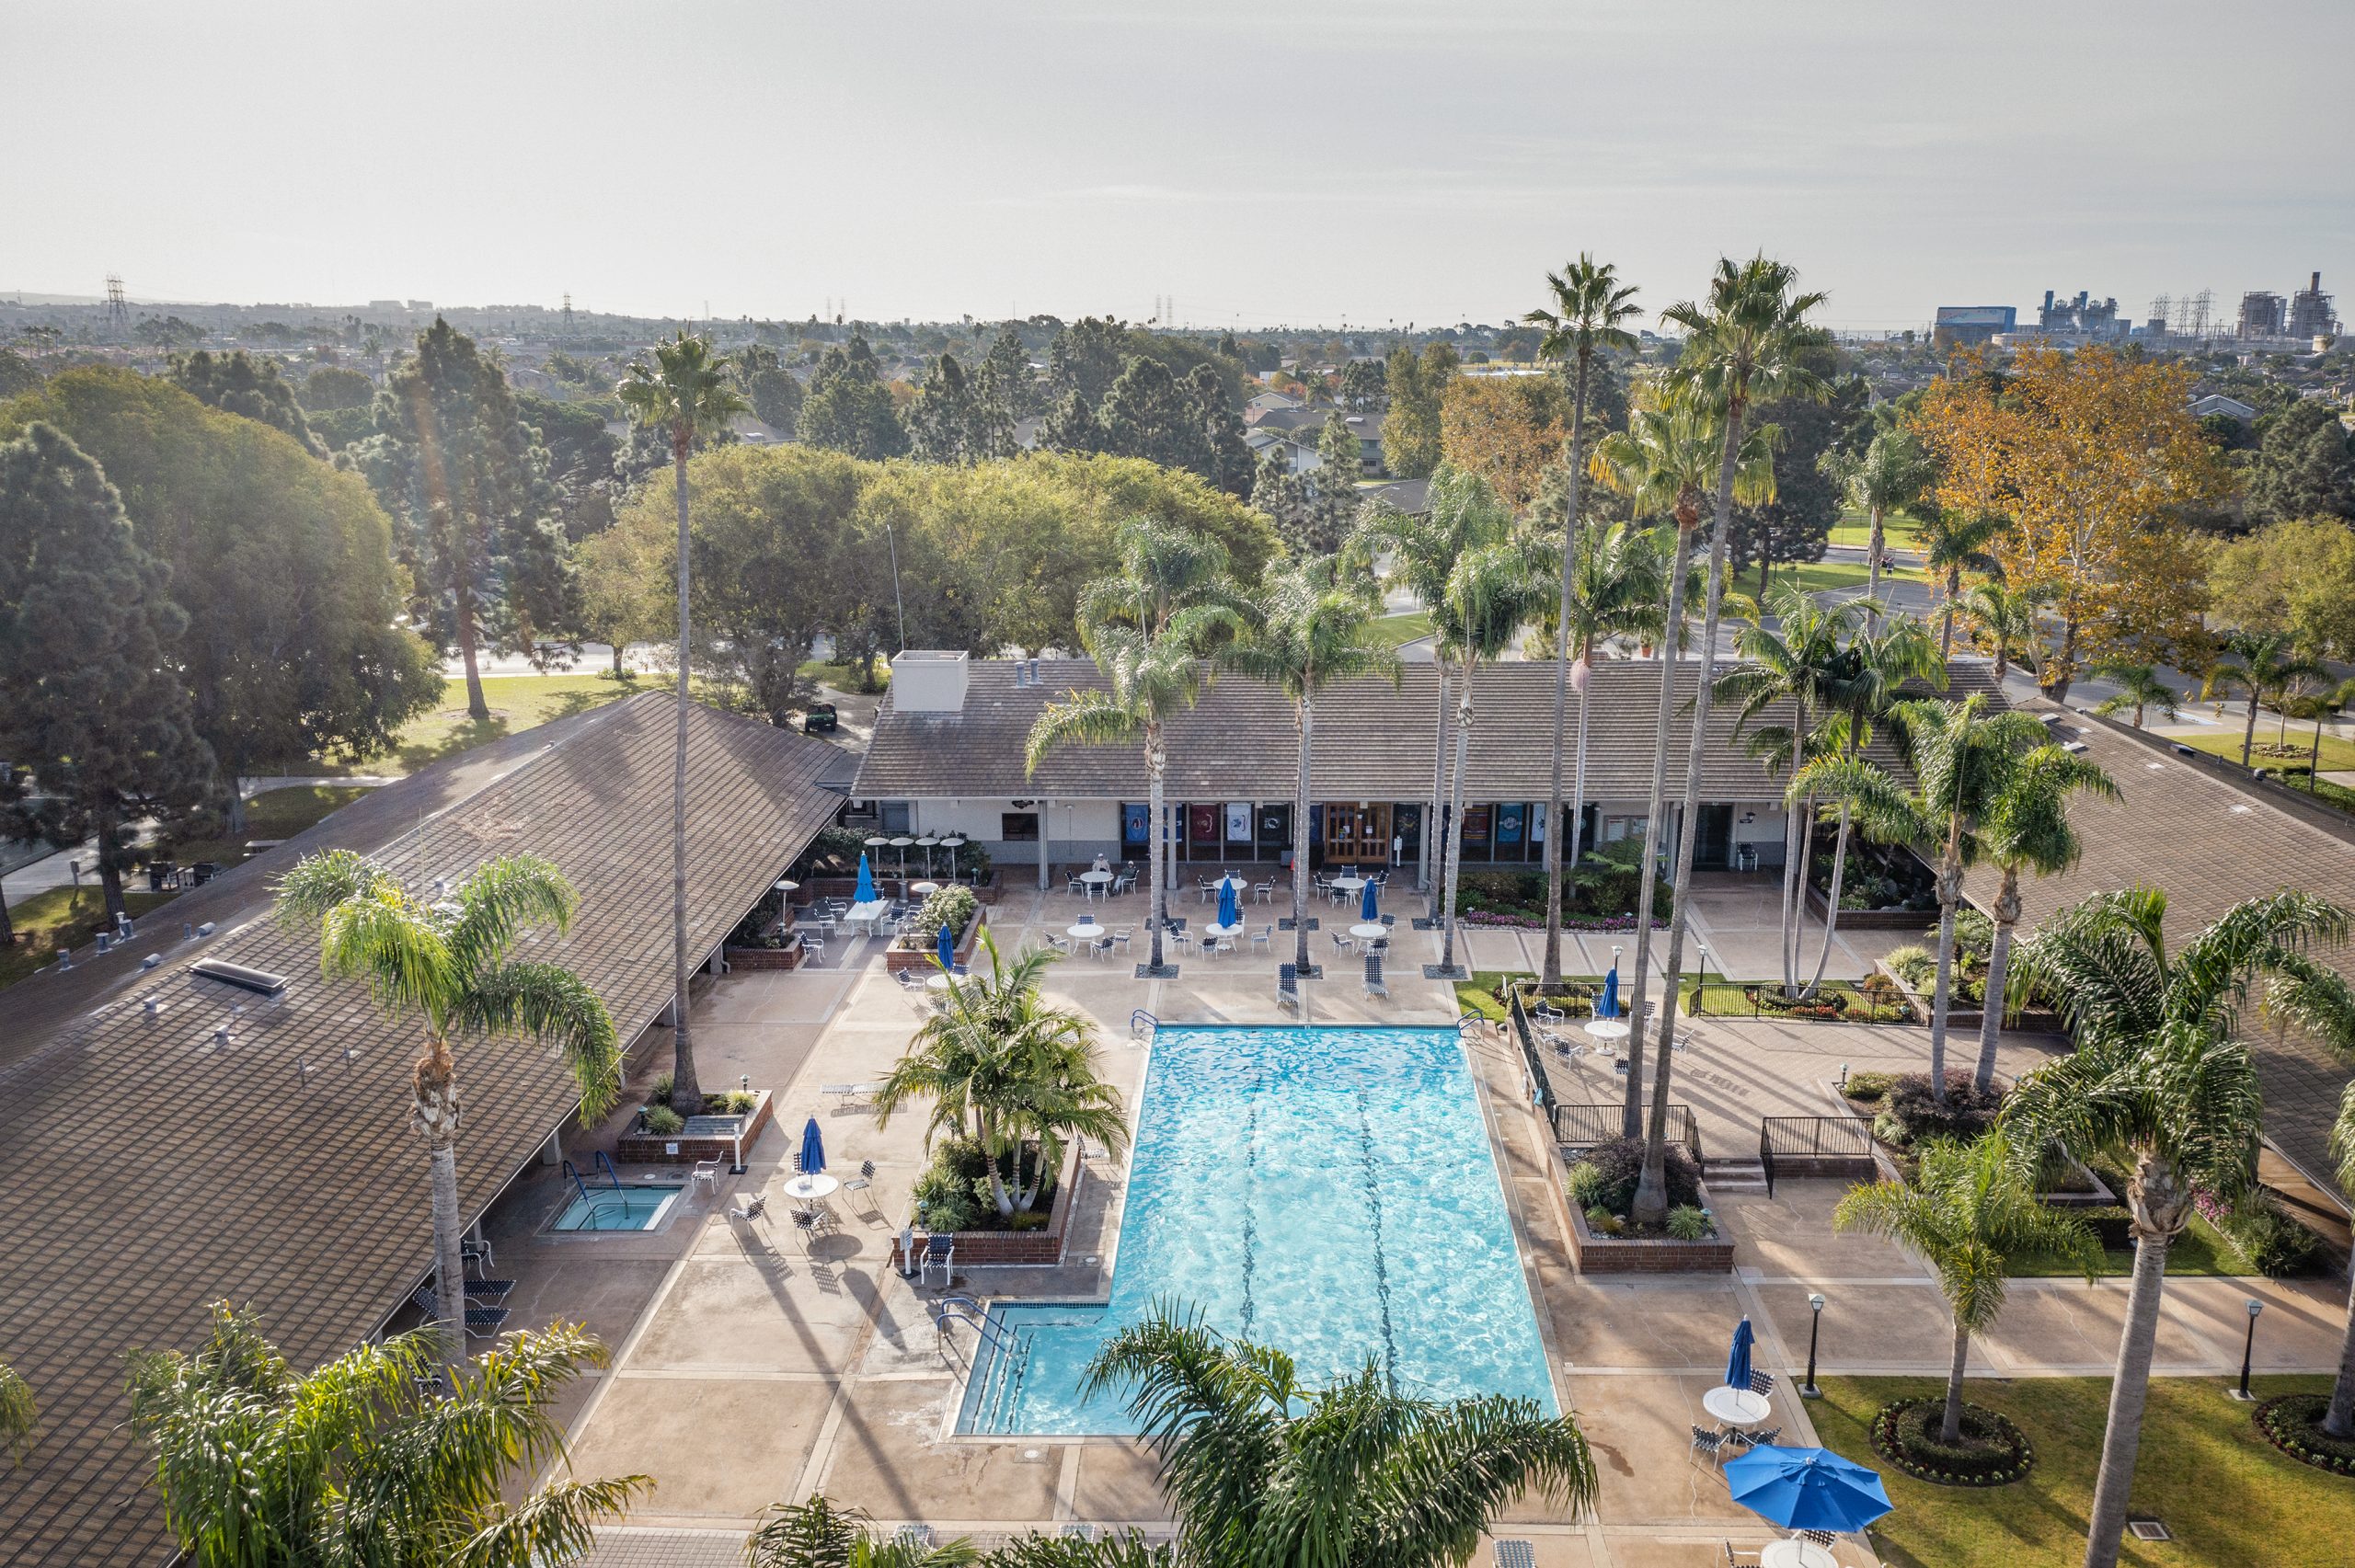
- Independent Living Communities (Age 55+): Ideal for active seniors who want a social environment with access to planned activities and amenities. Examples include Huntington Landmark and Windward Cove.
When evaluating retirement communities, consider proximity to family, available activities, and the cost of transitioning to higher levels of care.
Planning for the Future
While it’s exciting to think about retirement, it’s also important to plan for the later stages of life. Discuss these topics with your partner and family:
- Long-Term Care Options: Decide whether you prefer to stay in your home with the help of a live-in caregiver or transition to a care facility.
- Size and Space: A home with an extra bedroom may be useful for family visits or for live-in assistance in the future.
- Estate Planning: Set up trusts and legal documents to ensure your wishes are followed if you’re unable to make decisions for yourself.
Final Thoughts
Huntington Beach offers retirees the chance to enjoy an active, fulfilling lifestyle in a stunning coastal setting. By planning ahead and considering your financial, social, and health needs, you can find a home that supports your golden years. Whether you choose to settle in a cozy beachside bungalow, a low-maintenance condo, or a retirement community, the right home will help you make the most of this exciting chapter in your life.
Important tip: Do not assume working with a big “team” or “group” will result in you working with the most knowledgeable and experienced agent. While the “teams” tout their success in closing many homes and being #1 (in the state, country, or universe), the fact is they have many realtors who give “credit” to just one “team leader”. When listing your home, you may speak to that team leader initially, but your file will most likely be passed to a junior associate for the remainder of the transaction. The junior associate will have nowhere near the education, experience, and skill to be found in a top individual Realtor working in your market. A top individual agent will have assistants that help with photography, marketing, and transaction paperwork, but the important transaction tasks will be handled by the Realtor you hired!

 Several real estate and business-focused news outlets have published RealTrends agent rankings in the past.These rankings, which highlight top-performing real estate agents and teams, are often featured by a mix of national and regional publications.
 It is an honor to receive this award! I am very grateful to my past & current clients for their support, and their kind words… many naming me the “Best Realtor” in Huntington Beach in their